| Red | Green | Blue | |
| z | 17.64 | ||
| znorm | Inf | ||
| sky | -Inf | -Inf | -Inf |
| S/N | 23.6 | 38.8 | 43.4 |
| S/N(c) | 0.0 | 0.0 | 0.0 |
| SN(E/C) |
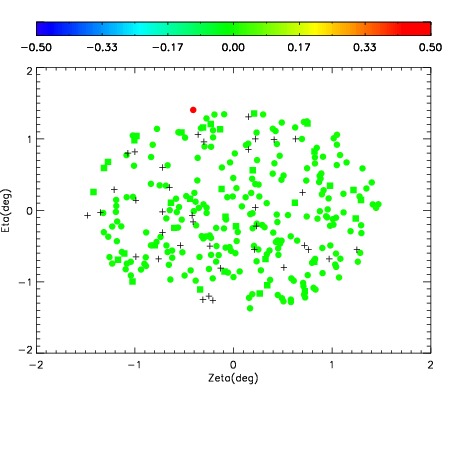
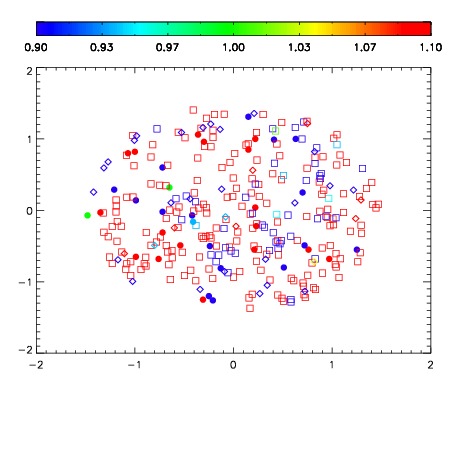
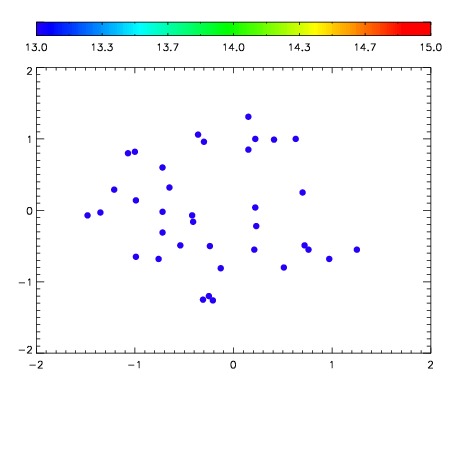

| Frame | Nreads | Zeropoints | Mag plots | Spatial mag deviation | Spatial sky 16325A emission deviations (filled: sky, open: star) | Spatial sky continuum emission | Spatial sky telluric CO2 absorption deviations (filled: H < 10) | |||||||||||||||||||||||
| 0 | 0 |
|
|
|
|
|
|
| IPAIR | NAME | SHIFT | NEWSHIFT | S/N | NAME | SHIFT | NEWSHIFT | S/N |
| 0 | 12240072 | 0.492098 | 0.00000 | 178.381 | 12240070 | -0.000449496 | 0.492548 | 173.218 |
| 1 | 12240071 | 0.491170 | 0.000928015 | 181.691 | 12240073 | 0.000185547 | 0.491912 | 187.577 |
| 2 | 12240068 | 0.490504 | 0.00159401 | 171.801 | 12240069 | -0.000407229 | 0.492505 | 168.372 |
| 3 | 12240067 | 0.490620 | 0.00147802 | 166.195 | 12240066 | 0.00000 | 0.492098 | 164.015 |