| Red | Green | Blue | |
| z | 17.64 | ||
| znorm | Inf | ||
| sky | -Inf | -Inf | -Inf |
| S/N | 18.7 | 33.5 | 38.9 |
| S/N(c) | 0.0 | 0.0 | 0.0 |
| SN(E/C) |
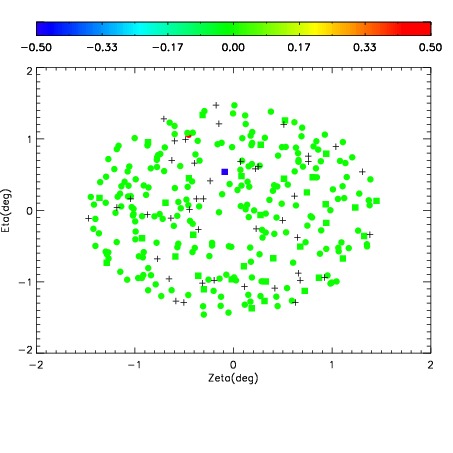
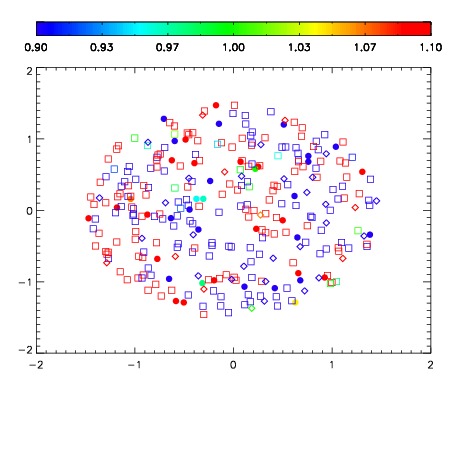
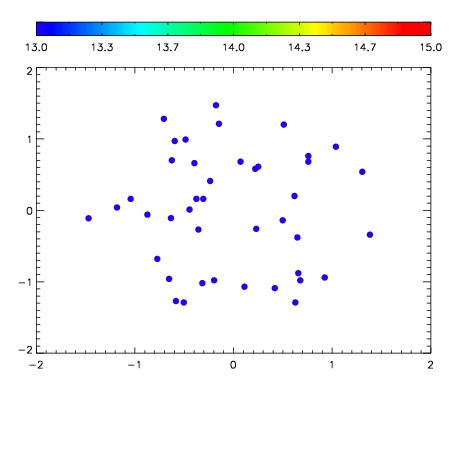

| Frame | Nreads | Zeropoints | Mag plots | Spatial mag deviation | Spatial sky 16325A emission deviations (filled: sky, open: star) | Spatial sky continuum emission | Spatial sky telluric CO2 absorption deviations (filled: H < 10) | |||||||||||||||||||||||
| 0 | 0 |
|
|
|
|
|
|
| IPAIR | NAME | SHIFT | NEWSHIFT | S/N | NAME | SHIFT | NEWSHIFT | S/N |
| 0 | 05180072 | 0.500436 | 0.00000 | 242.858 | 05180073 | 0.00431865 | 0.496117 | 237.384 |
| 1 | 05180068 | 0.499866 | 0.000569999 | 225.794 | 05180066 | 0.00000 | 0.500436 | 235.924 |
| 2 | 05180067 | 0.495908 | 0.00452802 | 169.154 | 05180069 | 0.00304408 | 0.497392 | 143.685 |
| 3 | 05180071 | 0.493359 | 0.00707701 | -5.39838e-09 | 05180070 | 0.000184265 | 0.500252 | 118.024 |