| Red | Green | Blue | |
| z | 17.64 | ||
| znorm | Inf | ||
| sky | -Inf | -NaN | -Inf |
| S/N | 17.6 | 30.8 | 33.1 |
| S/N(c) | 0.0 | 0.0 | 0.0 |
| SN(E/C) |
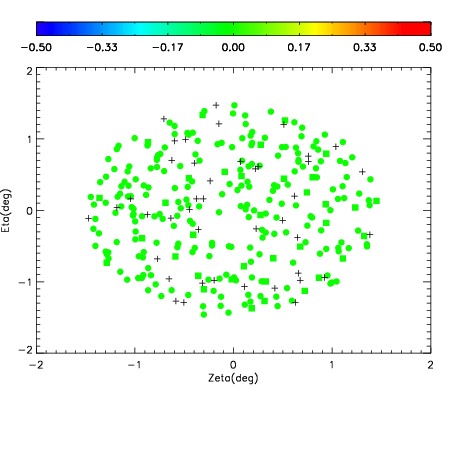
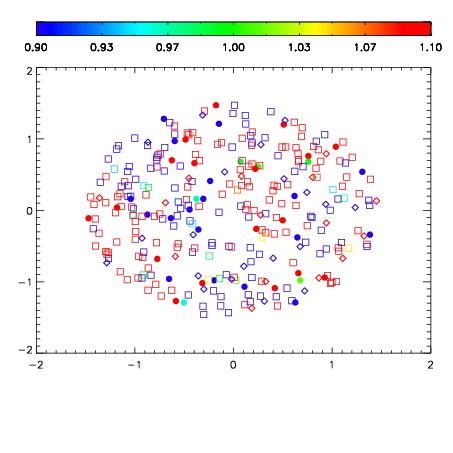
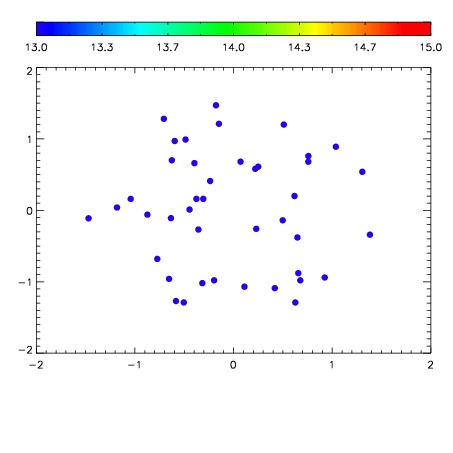

| Frame | Nreads | Zeropoints | Mag plots | Spatial mag deviation | Spatial sky 16325A emission deviations (filled: sky, open: star) | Spatial sky continuum emission | Spatial sky telluric CO2 absorption deviations (filled: H < 10) | |||||||||||||||||||||||
| 0 | 0 |
|
|
|
|
|
|
| IPAIR | NAME | SHIFT | NEWSHIFT | S/N | NAME | SHIFT | NEWSHIFT | S/N |
| 0 | 06420013 | 0.479210 | 0.00000 | 214.697 | 06420015 | -0.00381257 | 0.483023 | 181.922 |
| 1 | 06420017 | 0.478562 | 0.000647992 | 245.558 | 06420018 | -0.00361989 | 0.482830 | 251.274 |
| 2 | 06420016 | 0.478224 | 0.000985980 | 213.689 | 06420011 | 0.00000 | 0.479210 | 181.081 |
| 3 | 06420012 | 0.478903 | 0.000306994 | 203.435 | 06420014 | -0.000297254 | 0.479507 | 172.661 |