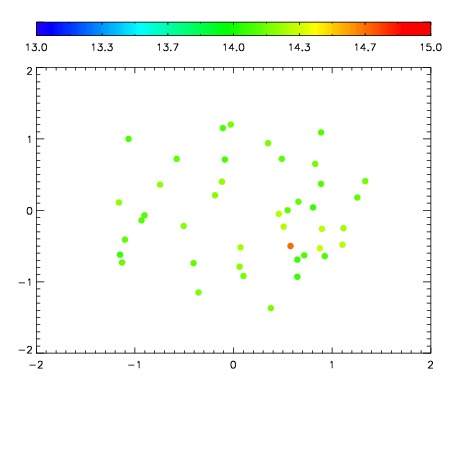
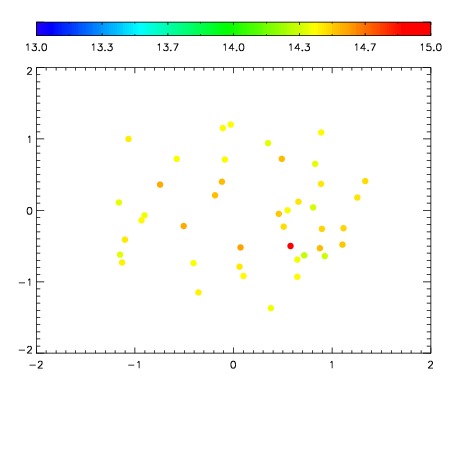
| Frame | Nreads | Zeropoints | Mag plots
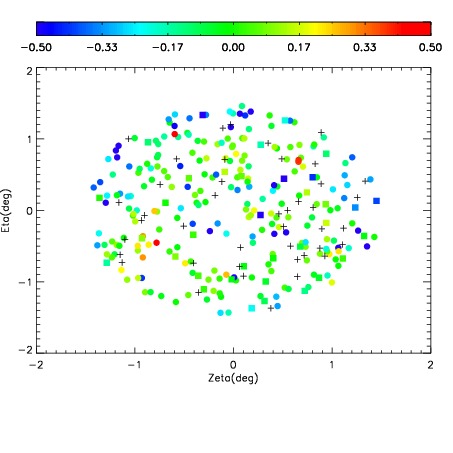
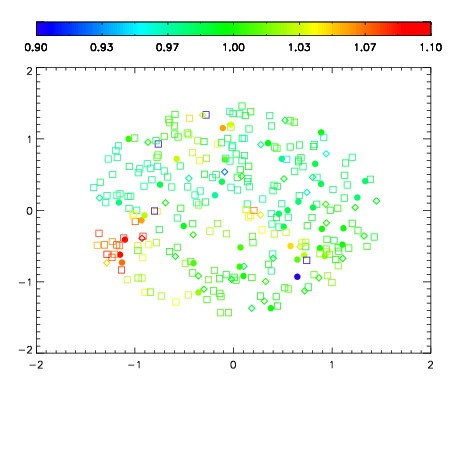
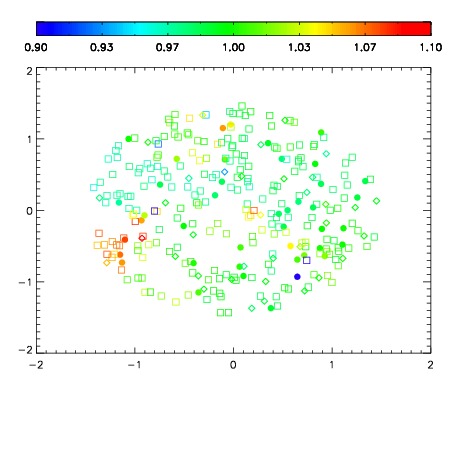
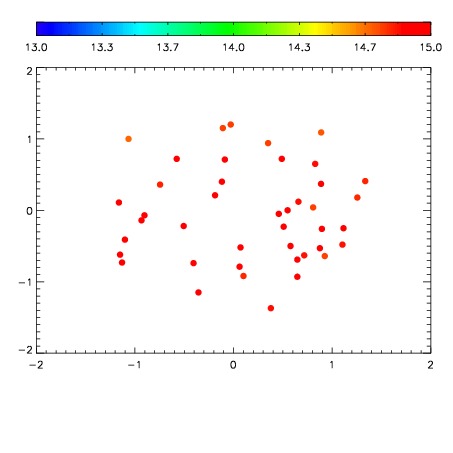
| Spatial mag deviation
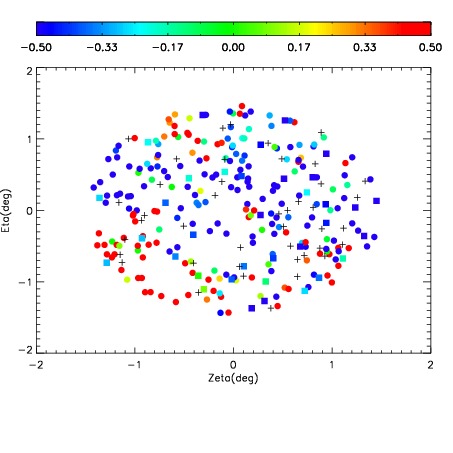
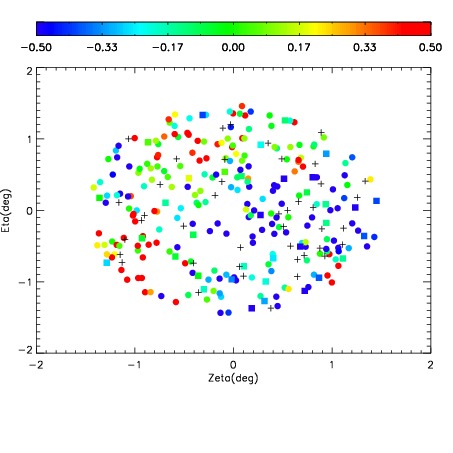
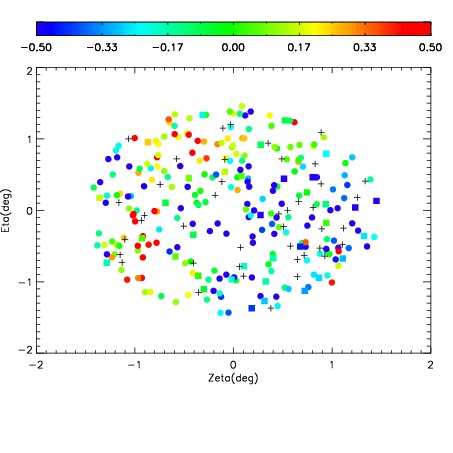
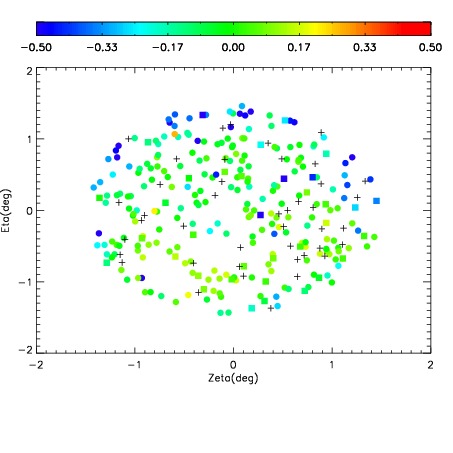
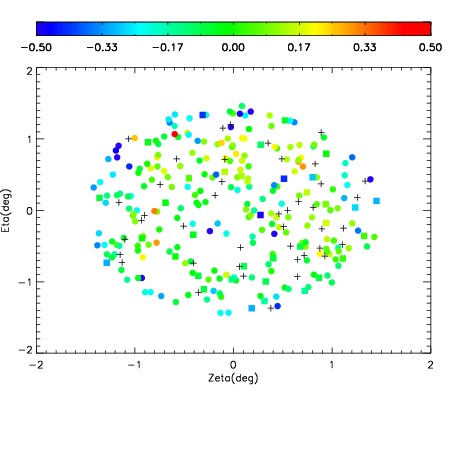
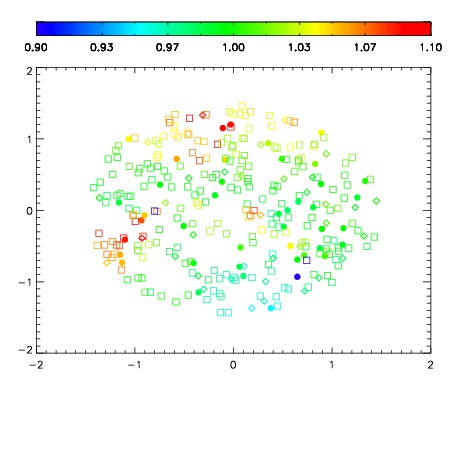
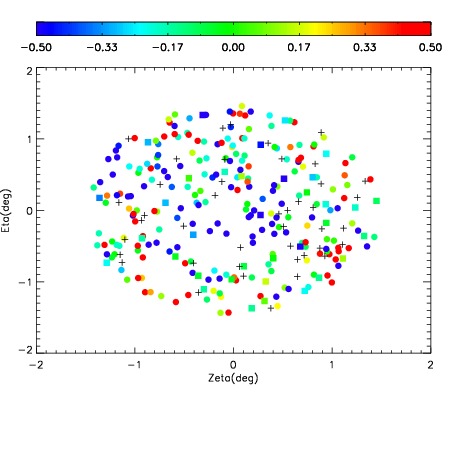
| Spatial sky 16325A emission deviations (filled: sky, open: star)
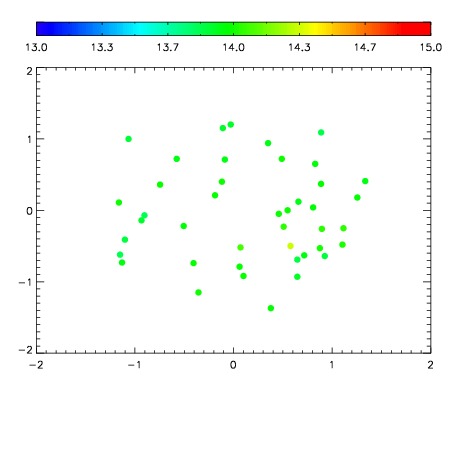
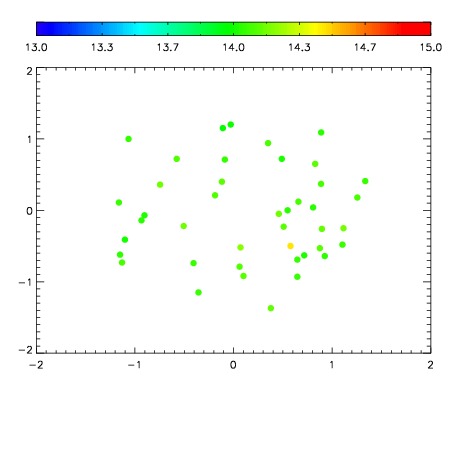
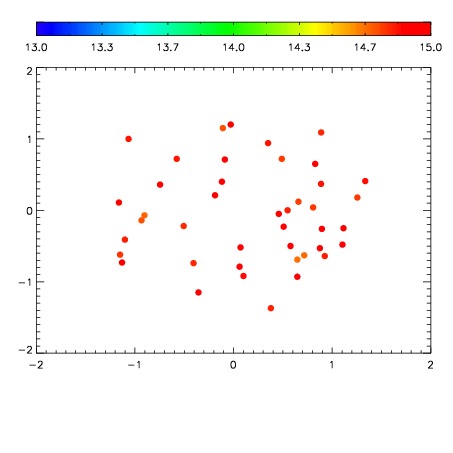
| Spatial sky continuum emission
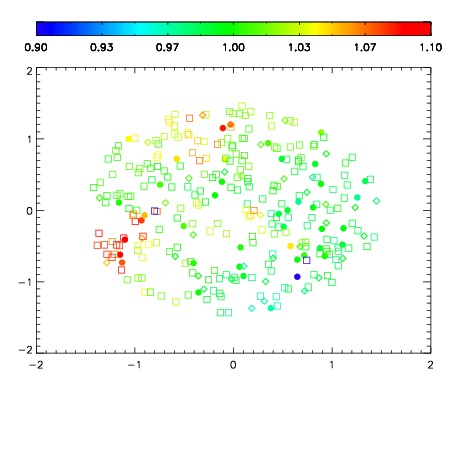
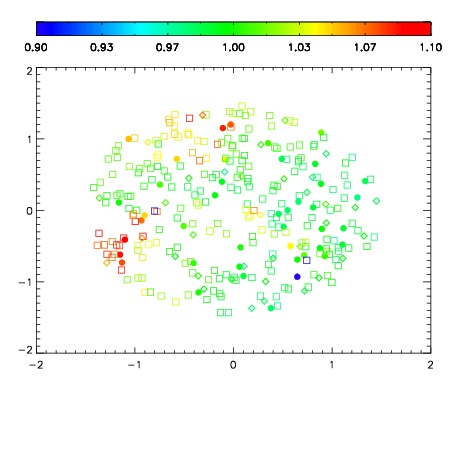
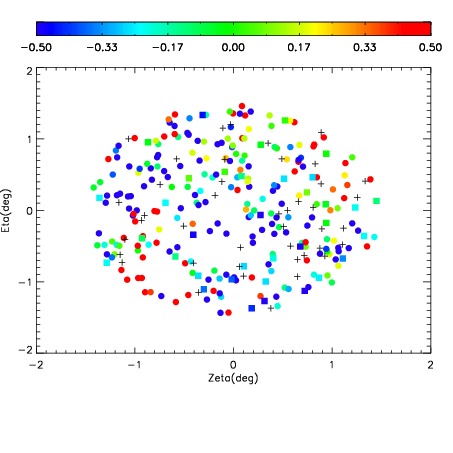
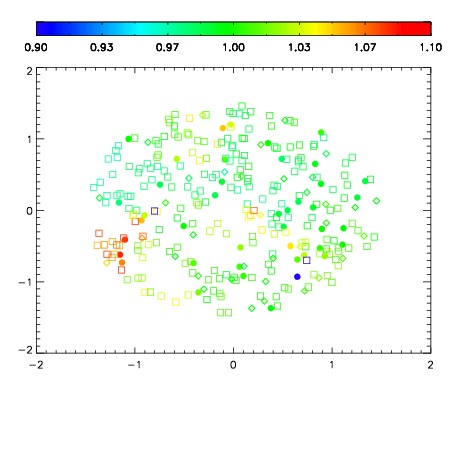
| Spatial sky telluric CO2 absorption deviations (filled: H < 10)
|
| 8730070
| 47
| | Red | Green | Blue
| | z | | 14.01
| | znorm | | 9.83
| | sky | 14.0 | 13.9 | 14.0
| | S/N | 0.2 | 0.7 | 0.2
| | S/N(c) | 0.0 | 0.0 | 0.0
| | SN(E/C) 2.13
|
| 
| 
| 
| 
| 
|
| 8730071
| 47
| | Red | Green | Blue
| | z | | 14.72
| | znorm | | 10.54
| | sky | 14.0 | 14.0 | 14.4
| | S/N | 0.4 | 1.1 | 1.2
| | S/N(c) | 0.3 | 1.0 | 1.1
| | SN(E/C) 1.01
|
| 
| 
| 
| 
| 
|
| 8730072
| 47
| | Red | Green | Blue
| | z | | 15.10
| | znorm | | 10.92
| | sky | 14.1 | 14.1 | 14.5
| | S/N | 0.6 | 1.2 | 1.3
| | S/N(c) | 0.5 | 1.1 | 1.4
| | SN(E/C) 1.00
|
| 
| 
| 
| 
| 
|
| 8730073
| 47
| | Red | Green | Blue
| | z | | 16.06
| | znorm | | 11.88
| | sky | 14.2 | 14.2 | 14.5
| | S/N | 1.3 | 3.1 | 3.3
| | S/N(c) | 1.2 | 2.9 | 3.1
| | SN(E/C) 0.95
|
| 
| 
| 
| 
| 
|
| 8730074
| 47
| | Red | Green | Blue
| | z | | 17.13
| | znorm | | 12.95
| | sky | 14.6 | 14.4 | 14.9
| | S/N | 3.7 | 7.6 | 8.8
| | S/N(c) | 3.1 | 7.0 | 8.0
| | SN(E/C) 0.99
|
| 
| 
| 
| 
| 
|
| 8730075
| 47
| | Red | Green | Blue
| | z | | 16.43
| | znorm | | 12.25
| | sky | 14.7 | 14.8 | 15.1
| | S/N | 1.8 | 4.5 | 4.8
| | S/N(c) | 1.6 | 4.0 | 4.3
| | SN(E/C) 0.97
|
| 
| 
| 
| 
| 
|
| 8730076
| 47
| | Red | Green | Blue
| | z | | 13.85
| | znorm | | 9.67
| | sky | 14.6 | 14.8 | 15.6
| | S/N | 0.2 | 0.5 | 0.2
| | S/N(c) | 0.0 | 0.0 | 0.0
| | SN(E/C) 1.21
|
| 
| 
| 
| 
| 
|
| 8730077
| 47
| | Red | Green | Blue
| | z | | 13.93
| | znorm | | 9.75
| | sky | 14.9 | 14.9 | 15.6
| | S/N | 0.2 | 0.6 | 0.5
| | S/N(c) | 0.0 | 0.0 | 0.0
| | SN(E/C) 1.31
|
| 
| 
| 
| 
| 
|