| Red | Green | Blue | |
| z | 17.64 | ||
| znorm | Inf | ||
| sky | -Inf | -Inf | -Inf |
| S/N | 26.6 | 46.7 | 53.2 |
| S/N(c) | 0.0 | 0.0 | 0.0 |
| SN(E/C) |
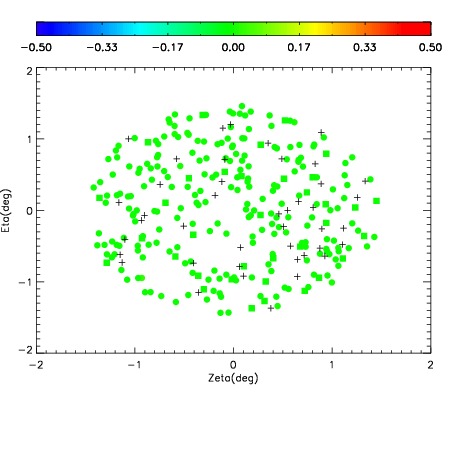
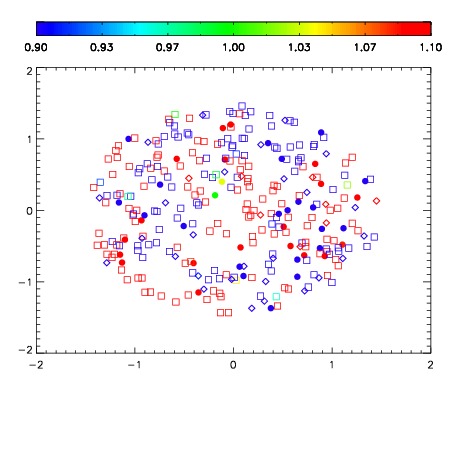
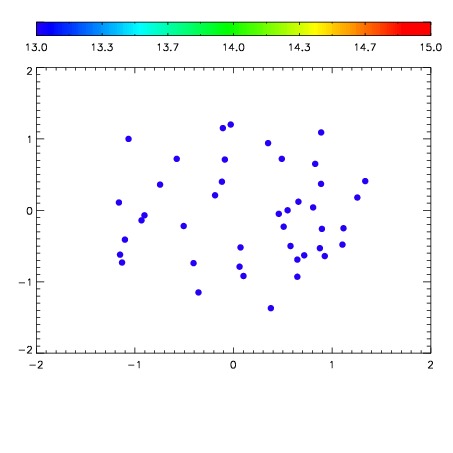

| Frame | Nreads | Zeropoints | Mag plots | Spatial mag deviation | Spatial sky 16325A emission deviations (filled: sky, open: star) | Spatial sky continuum emission | Spatial sky telluric CO2 absorption deviations (filled: H < 10) | |||||||||||||||||||||||
| 0 | 0 |
|
|
|
|
|
|
| IPAIR | NAME | SHIFT | NEWSHIFT | S/N | NAME | SHIFT | NEWSHIFT | S/N |
| 0 | 08750035 | 0.484582 | 0.00000 | 255.090 | 08750037 | 0.00286357 | 0.481718 | 257.181 |
| 1 | 08750039 | 0.482164 | 0.00241801 | 253.114 | 08750036 | 0.00345464 | 0.481127 | 255.991 |
| 2 | 08750038 | 0.482476 | 0.00210601 | 250.226 | 08750040 | 0.000274680 | 0.484307 | 243.658 |
| 3 | 08750042 | 0.483052 | 0.00153002 | 248.274 | 08750041 | -1.12894e-05 | 0.484593 | 240.131 |
| 4 | 08750034 | 0.483768 | 0.000814021 | 234.732 | 08750033 | 0.00000 | 0.484582 | 204.716 |