| Red | Green | Blue | |
| z | 17.64 | ||
| znorm | Inf | ||
| sky | -Inf | -Inf | -Inf |
| S/N | 28.0 | 46.8 | 52.8 |
| S/N(c) | 0.0 | 0.0 | 0.0 |
| SN(E/C) |
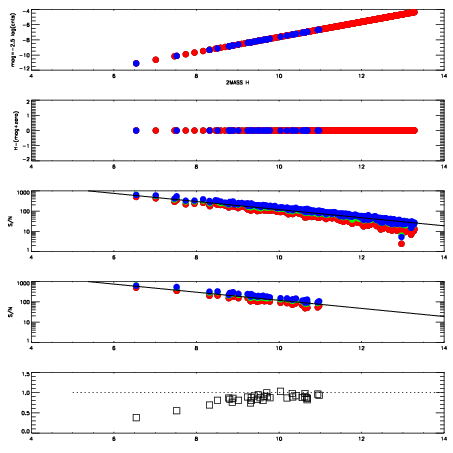
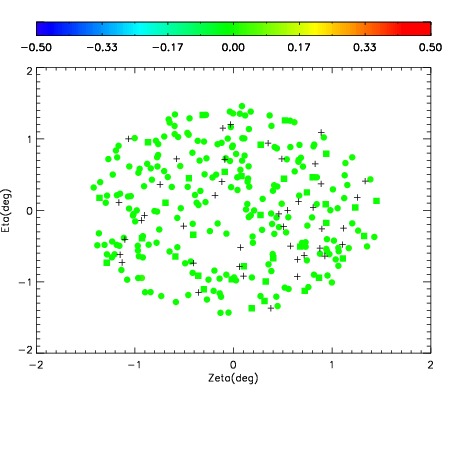
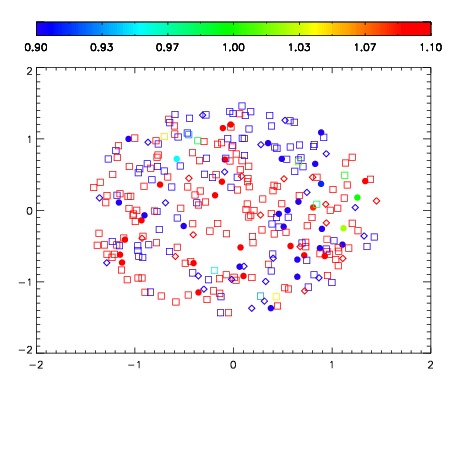


| Frame | Nreads | Zeropoints | Mag plots | Spatial mag deviation | Spatial sky 16325A emission deviations (filled: sky, open: star) | Spatial sky continuum emission | Spatial sky telluric CO2 absorption deviations (filled: H < 10) | |||||||||||||||||||||||
| 0 | 0 |
|
|
|
|
|
|
| IPAIR | NAME | SHIFT | NEWSHIFT | S/N | NAME | SHIFT | NEWSHIFT | S/N |
| 0 | 08820032 | 0.481178 | 0.00000 | 243.775 | 08820029 | 0.00236546 | 0.478813 | 243.634 |
| 1 | 08820028 | 0.479792 | 0.00138599 | 247.320 | 08820033 | 0.00237155 | 0.478806 | 247.725 |
| 2 | 08820031 | 0.480766 | 0.000411987 | 241.273 | 08820030 | 0.00233280 | 0.478845 | 239.146 |
| 3 | 08820027 | 0.479736 | 0.00144199 | 240.978 | 08820026 | 0.00000 | 0.481178 | 231.895 |