| Red | Green | Blue | |
| z | 17.64 | ||
| znorm | Inf | ||
| sky | -Inf | -Inf | -Inf |
| S/N | 23.2 | 39.8 | 44.6 |
| S/N(c) | 0.0 | 0.0 | 0.0 |
| SN(E/C) |
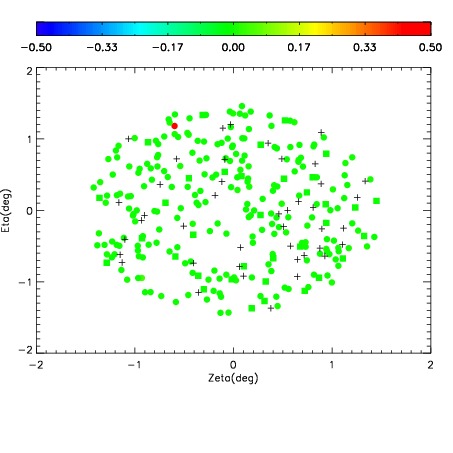
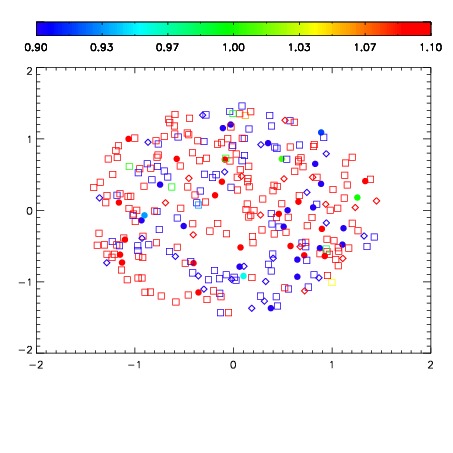
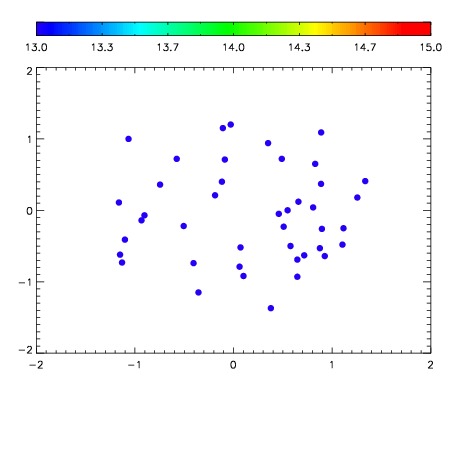

| Frame | Nreads | Zeropoints | Mag plots | Spatial mag deviation | Spatial sky 16325A emission deviations (filled: sky, open: star) | Spatial sky continuum emission | Spatial sky telluric CO2 absorption deviations (filled: H < 10) | |||||||||||||||||||||||
| 0 | 0 |
|
|
|
|
|
|
| IPAIR | NAME | SHIFT | NEWSHIFT | S/N | NAME | SHIFT | NEWSHIFT | S/N |
| 0 | 09090028 | 0.485274 | 0.00000 | 245.221 | 09090022 | 0.00000 | 0.485274 | 243.637 |
| 1 | 09090027 | 0.484911 | 0.000362992 | 235.334 | 09090026 | 0.00525150 | 0.480022 | 241.023 |
| 2 | 09090023 | 0.483856 | 0.00141799 | 229.523 | 09090029 | 0.00504515 | 0.480229 | 223.799 |
| 3 | 09090024 | 0.483617 | 0.00165698 | 227.112 | 09090025 | 0.00430143 | 0.480973 | 190.692 |