| Red | Green | Blue | |
| z | 17.64 | ||
| znorm | Inf | ||
| sky | -NaN | -Inf | -Inf |
| S/N | 26.1 | 45.7 | 47.4 |
| S/N(c) | 0.0 | 0.0 | 0.0 |
| SN(E/C) |
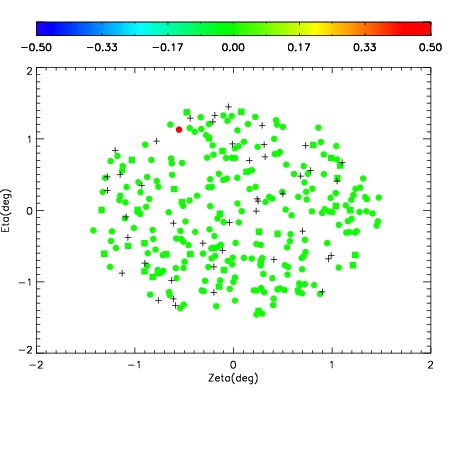
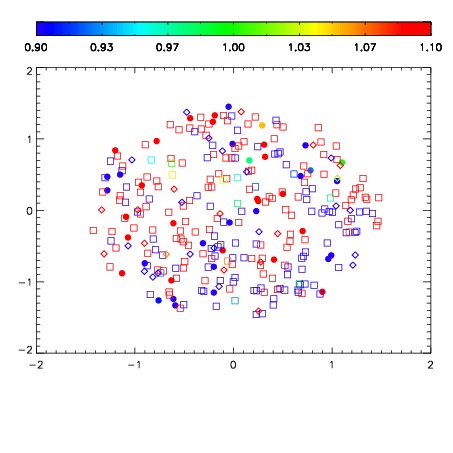
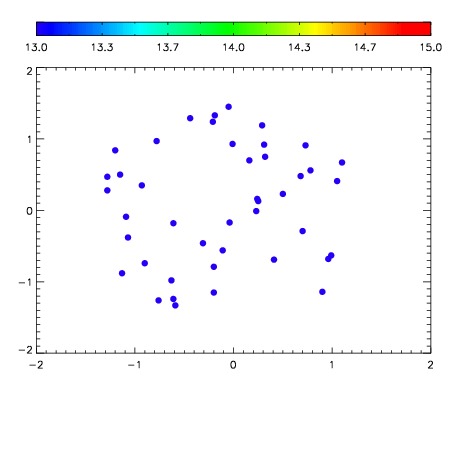

| Frame | Nreads | Zeropoints | Mag plots | Spatial mag deviation | Spatial sky 16325A emission deviations (filled: sky, open: star) | Spatial sky continuum emission | Spatial sky telluric CO2 absorption deviations (filled: H < 10) | |||||||||||||||||||||||
| 0 | 0 |
|
|
|
|
|
|
| IPAIR | NAME | SHIFT | NEWSHIFT | S/N | NAME | SHIFT | NEWSHIFT | S/N |
| 0 | 12170028 | 0.495253 | 0.00000 | 164.696 | 12170029 | -0.00400280 | 0.499256 | 167.280 |
| 1 | 12170027 | 0.494210 | 0.00104299 | 161.201 | 12170026 | -0.00339928 | 0.498652 | 165.101 |
| 2 | 12170024 | 0.493985 | 0.00126800 | 159.169 | 12170025 | -0.00348587 | 0.498739 | 162.280 |
| 3 | 12170023 | 0.493265 | 0.00198799 | 158.628 | 12170022 | 0.00000 | 0.495253 | 156.344 |