| Red | Green | Blue | |
| z | 17.64 | ||
| znorm | Inf | ||
| sky | -Inf | -Inf | -Inf |
| S/N | 26.1 | 46.2 | 48.8 |
| S/N(c) | 0.0 | 0.0 | 0.0 |
| SN(E/C) |
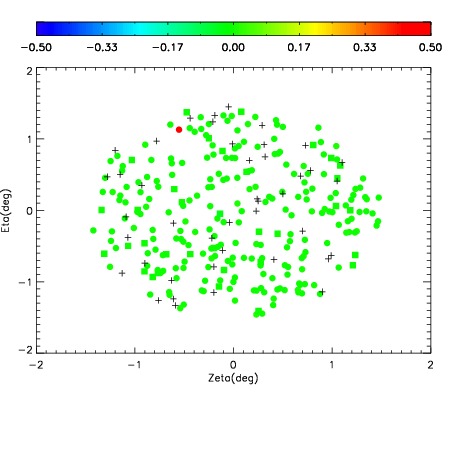
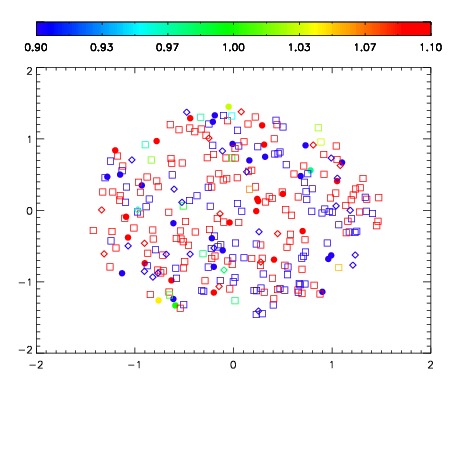


| Frame | Nreads | Zeropoints | Mag plots | Spatial mag deviation | Spatial sky 16325A emission deviations (filled: sky, open: star) | Spatial sky continuum emission | Spatial sky telluric CO2 absorption deviations (filled: H < 10) | |||||||||||||||||||||||
| 0 | 0 |
|
|
|
|
|
|
| IPAIR | NAME | SHIFT | NEWSHIFT | S/N | NAME | SHIFT | NEWSHIFT | S/N |
| 0 | 12210028 | 0.512705 | 0.00000 | 159.838 | 12210026 | 0.00000 | 0.512705 | 147.842 |
| 1 | 12210032 | 0.509674 | 0.00303102 | 166.390 | 12210033 | -0.00198886 | 0.514694 | 169.284 |
| 2 | 12210031 | 0.509579 | 0.00312603 | 164.527 | 12210030 | 0.000403728 | 0.512301 | 164.604 |
| 3 | 12210027 | 0.512353 | 0.000352025 | 160.827 | 12210029 | 0.000192111 | 0.512513 | 163.970 |