| Red | Green | Blue | |
| z | 17.64 | ||
| znorm | Inf | ||
| sky | -Inf | -Inf | -Inf |
| S/N | 30.2 | 51.2 | 54.7 |
| S/N(c) | 0.0 | 0.0 | 0.0 |
| SN(E/C) |
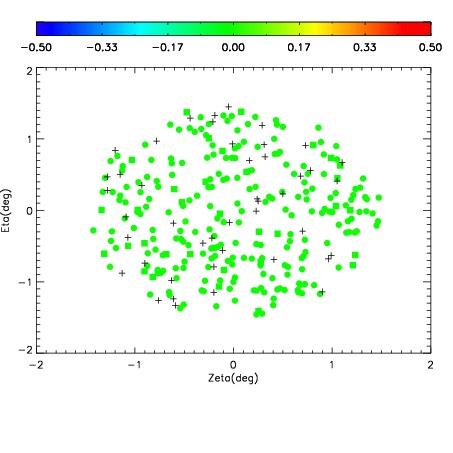
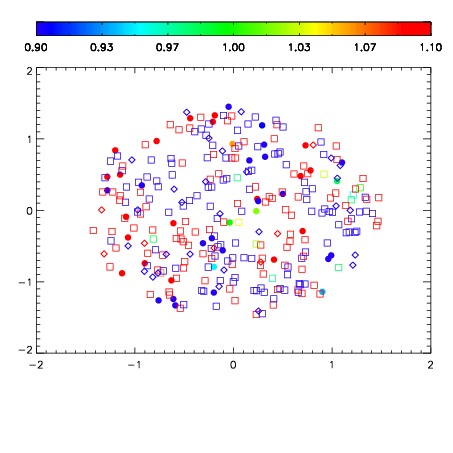
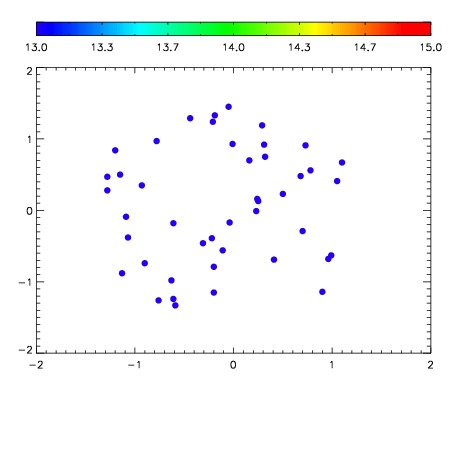

| Frame | Nreads | Zeropoints | Mag plots | Spatial mag deviation | Spatial sky 16325A emission deviations (filled: sky, open: star) | Spatial sky continuum emission | Spatial sky telluric CO2 absorption deviations (filled: H < 10) | |||||||||||||||||||||||
| 0 | 0 |
|
|
|
|
|
|
| IPAIR | NAME | SHIFT | NEWSHIFT | S/N | NAME | SHIFT | NEWSHIFT | S/N |
| 0 | 12250076 | 0.502389 | 0.00000 | 201.834 | 12250077 | 0.000757821 | 0.501631 | 205.323 |
| 1 | 12250075 | 0.501481 | 0.000908017 | 199.279 | 12250074 | 9.22494e-05 | 0.502297 | 197.861 |
| 2 | 12250072 | 0.498422 | 0.00396702 | 188.386 | 12250073 | -0.000515664 | 0.502905 | 188.322 |
| 3 | 12250071 | 0.498215 | 0.00417402 | 183.604 | 12250070 | 0.00000 | 0.502389 | 181.584 |