| Red | Green | Blue | |
| z | 17.64 | ||
| znorm | Inf | ||
| sky | -Inf | -Inf | -Inf |
| S/N | 14.9 | 29.7 | 32.1 |
| S/N(c) | 0.0 | 0.0 | 0.0 |
| SN(E/C) |
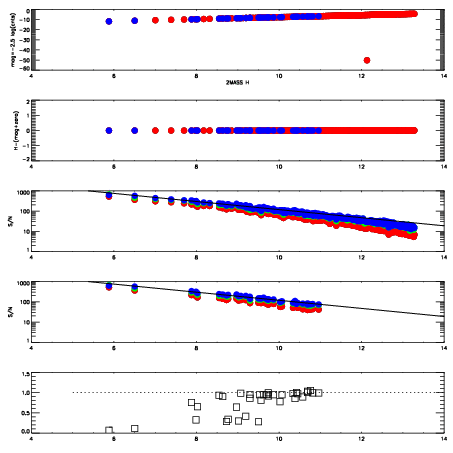
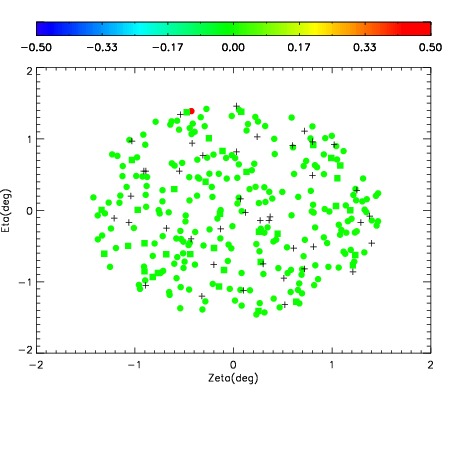
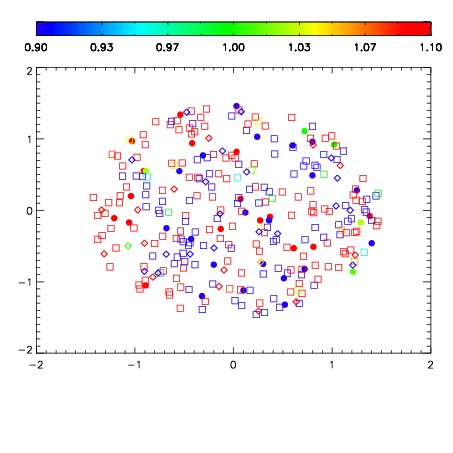
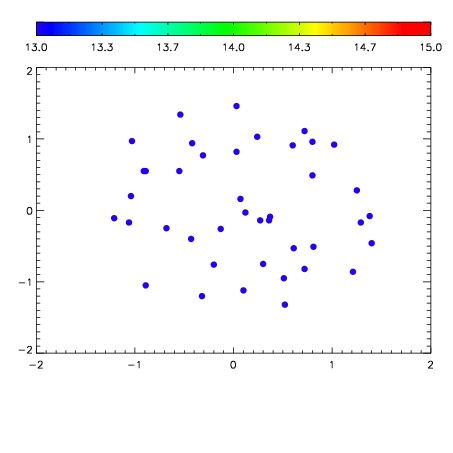

| Frame | Nreads | Zeropoints | Mag plots | Spatial mag deviation | Spatial sky 16325A emission deviations (filled: sky, open: star) | Spatial sky continuum emission | Spatial sky telluric CO2 absorption deviations (filled: H < 10) | |||||||||||||||||||||||
| 0 | 0 |
|
|
|
|
|
|
| IPAIR | NAME | SHIFT | NEWSHIFT | S/N | NAME | SHIFT | NEWSHIFT | S/N |
| 0 | 12130032 | 0.496841 | 0.00000 | 145.286 | 12130033 | 0.000692811 | 0.496148 | 160.102 |
| 1 | 12130027 | 0.494296 | 0.00254500 | 168.851 | 12130026 | 0.00000 | 0.496841 | 173.876 |
| 2 | 12130028 | 0.494376 | 0.00246501 | 163.565 | 12130029 | -0.000313660 | 0.497155 | 171.801 |
| 3 | 12130031 | 0.496285 | 0.000556022 | 156.766 | 12130030 | 0.000712903 | 0.496128 | 163.293 |