| Red | Green | Blue | |
| z | 17.64 | ||
| znorm | Inf | ||
| sky | -Inf | -Inf | -Inf |
| S/N | 24.7 | 44.9 | 45.3 |
| S/N(c) | 0.0 | 0.0 | 0.0 |
| SN(E/C) |
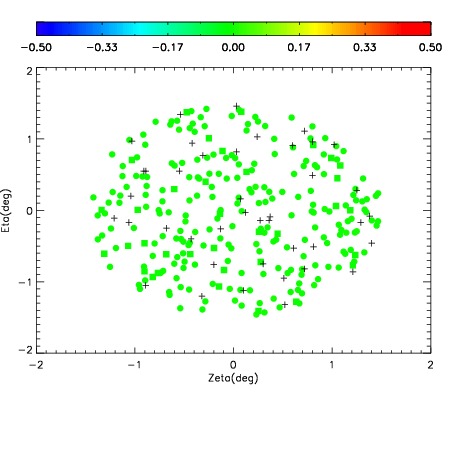
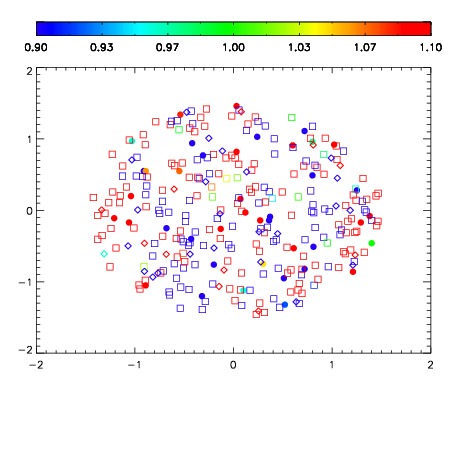
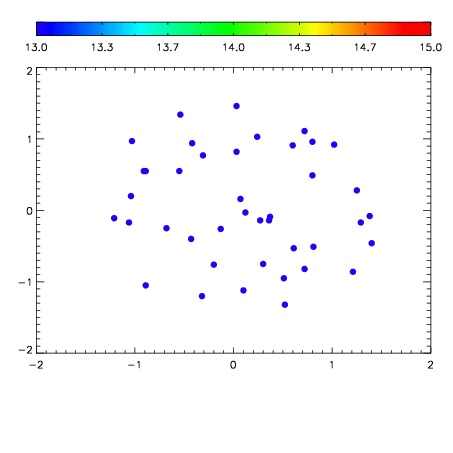

| Frame | Nreads | Zeropoints | Mag plots | Spatial mag deviation | Spatial sky 16325A emission deviations (filled: sky, open: star) | Spatial sky continuum emission | Spatial sky telluric CO2 absorption deviations (filled: H < 10) | |||||||||||||||||||||||
| 0 | 0 |
|
|
|
|
|
|
| IPAIR | NAME | SHIFT | NEWSHIFT | S/N | NAME | SHIFT | NEWSHIFT | S/N |
| 0 | 12190056 | 0.501328 | 0.00000 | 210.335 | 12190059 | -0.000923107 | 0.502251 | 210.725 |
| 1 | 12190061 | 0.501170 | 0.000158012 | 211.782 | 12190062 | -0.00300102 | 0.504329 | 214.203 |
| 2 | 12190060 | 0.500772 | 0.000555992 | 210.697 | 12190058 | -0.00107173 | 0.502400 | 213.434 |
| 3 | 12190057 | 0.500601 | 0.000726998 | 210.324 | 12190055 | 0.00000 | 0.501328 | 205.291 |