| Red | Green | Blue | |
| z | 17.64 | ||
| znorm | Inf | ||
| sky | -NaN | -Inf | -Inf |
| S/N | 22.5 | 38.9 | 42.7 |
| S/N(c) | 0.0 | 0.0 | 0.0 |
| SN(E/C) |

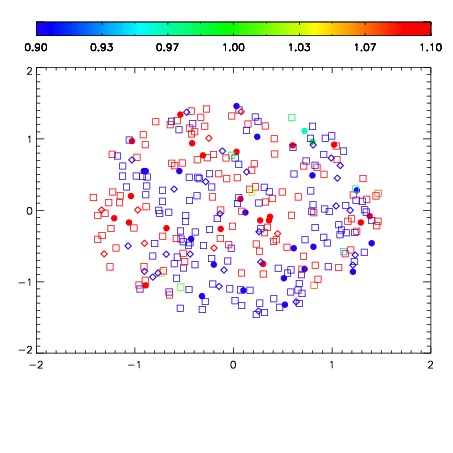
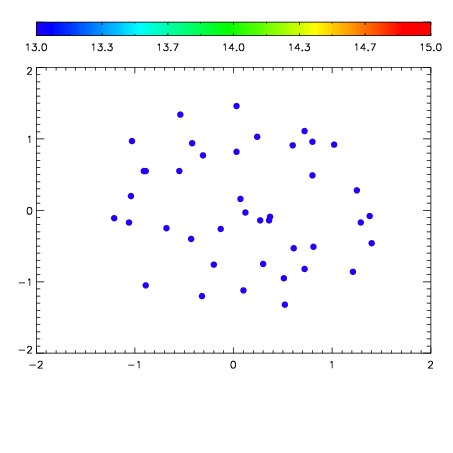

| Frame | Nreads | Zeropoints | Mag plots | Spatial mag deviation | Spatial sky 16325A emission deviations (filled: sky, open: star) | Spatial sky continuum emission | Spatial sky telluric CO2 absorption deviations (filled: H < 10) | |||||||||||||||||||||||
| 0 | 0 |
|
|
|
|
|
|
| IPAIR | NAME | SHIFT | NEWSHIFT | S/N | NAME | SHIFT | NEWSHIFT | S/N |
| 0 | 12310068 | 0.491898 | 0.00000 | 226.640 | 12310070 | 0.000583317 | 0.491315 | 229.795 |
| 1 | 12310071 | 0.490656 | 0.00124201 | 226.642 | 12310069 | 6.58142e-06 | 0.491891 | 231.687 |
| 2 | 12310067 | 0.491818 | 7.99894e-05 | 221.723 | 12310066 | 0.00000 | 0.491898 | 215.777 |
| 3 | 12310072 | 0.490748 | 0.00115001 | 218.621 | 12310073 | -0.00301275 | 0.494911 | 212.637 |