| Red | Green | Blue | |
| z | 17.64 | ||
| znorm | Inf | ||
| sky | -Inf | -Inf | -Inf |
| S/N | 24.9 | 43.2 | 43.8 |
| S/N(c) | 0.0 | 0.0 | 0.0 |
| SN(E/C) |

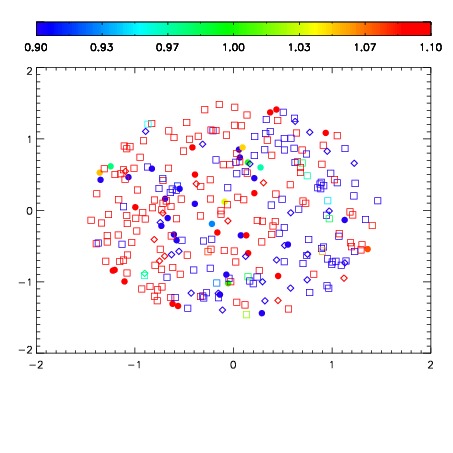
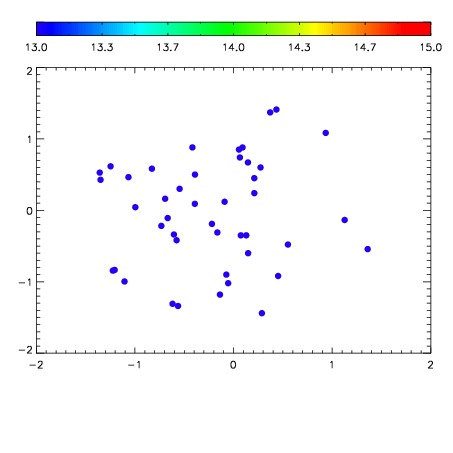

| Frame | Nreads | Zeropoints | Mag plots | Spatial mag deviation | Spatial sky 16325A emission deviations (filled: sky, open: star) | Spatial sky continuum emission | Spatial sky telluric CO2 absorption deviations (filled: H < 10) | |||||||||||||||||||||||
| 0 | 0 |
|
|
|
|
|
|
| IPAIR | NAME | SHIFT | NEWSHIFT | S/N | NAME | SHIFT | NEWSHIFT | S/N |
| 0 | 02600013 | 0.420807 | 0.00000 | 167.882 | 02600018 | 0.00485134 | 0.415956 | 172.028 |
| 1 | 02600016 | 0.419273 | 0.00153401 | 177.779 | 02600015 | -0.00105336 | 0.421860 | 175.223 |
| 2 | 02600017 | 0.419142 | 0.00166500 | 174.576 | 02600014 | 0.00293938 | 0.417868 | 173.464 |
| 3 | 02600012 | 0.419862 | 0.000945002 | 162.296 | 02600011 | 0.00000 | 0.420807 | 168.850 |