| Red | Green | Blue | |
| z | 17.64 | ||
| znorm | Inf | ||
| sky | -NaN | -Inf | -Inf |
| S/N | 26.3 | 43.0 | 46.1 |
| S/N(c) | 0.0 | 0.0 | 0.0 |
| SN(E/C) |

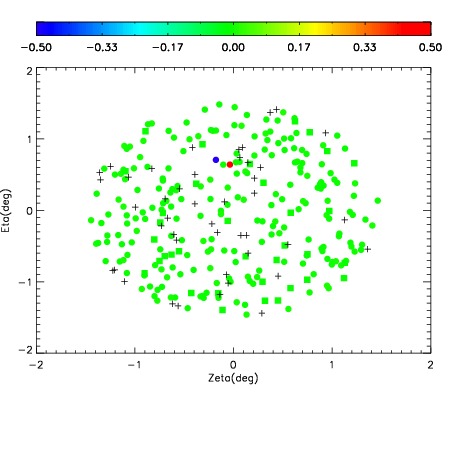
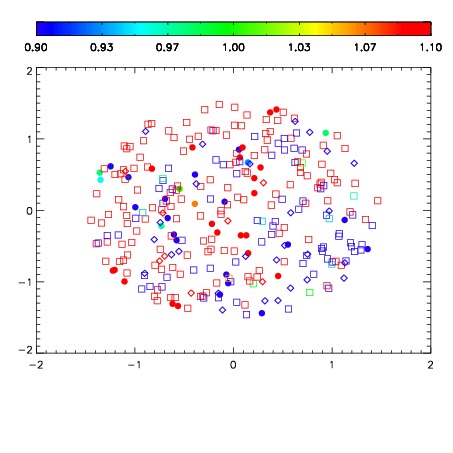


| Frame | Nreads | Zeropoints | Mag plots | Spatial mag deviation | Spatial sky 16325A emission deviations (filled: sky, open: star) | Spatial sky continuum emission | Spatial sky telluric CO2 absorption deviations (filled: H < 10) | |||||||||||||||||||||||
| 0 | 0 |
|
|
|
|
|
|
| IPAIR | NAME | SHIFT | NEWSHIFT | S/N | NAME | SHIFT | NEWSHIFT | S/N |
| 0 | 04890086 | 0.486798 | 0.00000 | 189.329 | 04890088 | -0.000890896 | 0.487689 | 186.869 |
| 1 | 04890089 | 0.484646 | 0.00215200 | 187.554 | 04890087 | 0.000481647 | 0.486316 | 186.004 |
| 2 | 04890085 | 0.485170 | 0.00162798 | 187.062 | 04890084 | 0.00000 | 0.486798 | 174.528 |