| Red | Green | Blue | |
| z | 17.64 | ||
| znorm | Inf | ||
| sky | -Inf | -Inf | -Inf |
| S/N | 24.7 | 42.2 | 46.8 |
| S/N(c) | 0.0 | 0.0 | 0.0 |
| SN(E/C) |
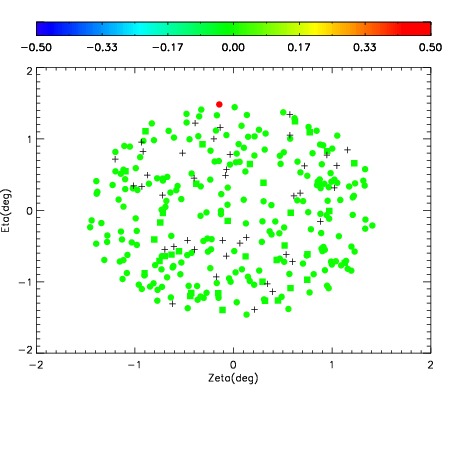
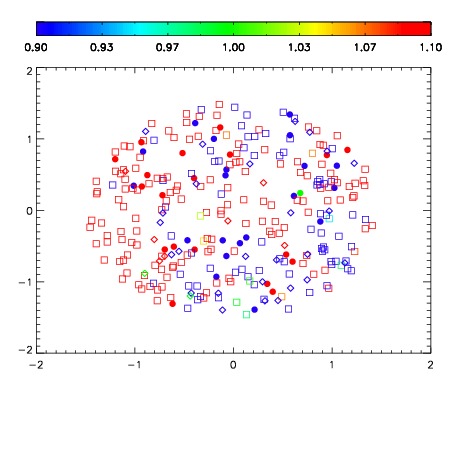
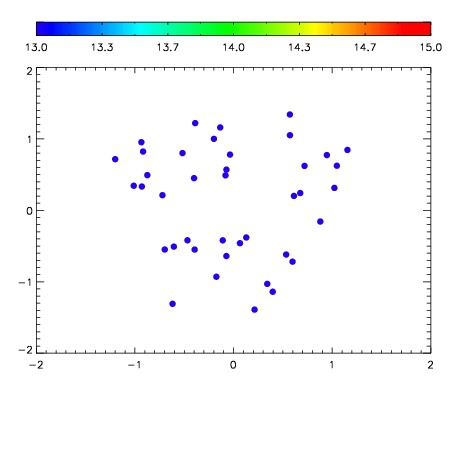

| Frame | Nreads | Zeropoints | Mag plots | Spatial mag deviation | Spatial sky 16325A emission deviations (filled: sky, open: star) | Spatial sky continuum emission | Spatial sky telluric CO2 absorption deviations (filled: H < 10) | |||||||||||||||||||||||
| 0 | 0 |
|
|
|
|
|
|
| IPAIR | NAME | SHIFT | NEWSHIFT | S/N | NAME | SHIFT | NEWSHIFT | S/N |
| 0 | 05170030 | 0.495891 | 0.00000 | 225.676 | 05170024 | 0.00000 | 0.495891 | 221.800 |
| 1 | 05170025 | 0.494709 | 0.00118199 | 225.841 | 05170031 | 0.00368534 | 0.492206 | 226.636 |
| 2 | 05170029 | 0.494073 | 0.00181800 | 223.031 | 05170027 | 0.00272152 | 0.493169 | 221.752 |
| 3 | 05170026 | 0.494087 | 0.00180399 | 218.893 | 05170028 | 0.00121326 | 0.494678 | 218.931 |