| Frame | Nreads | Zeropoints | Mag plots
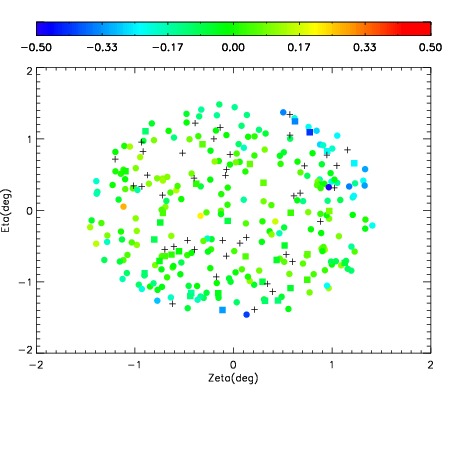
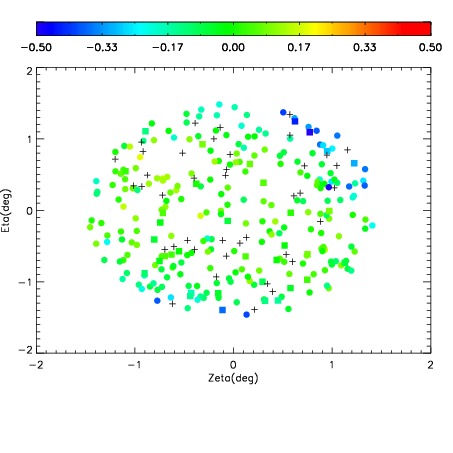
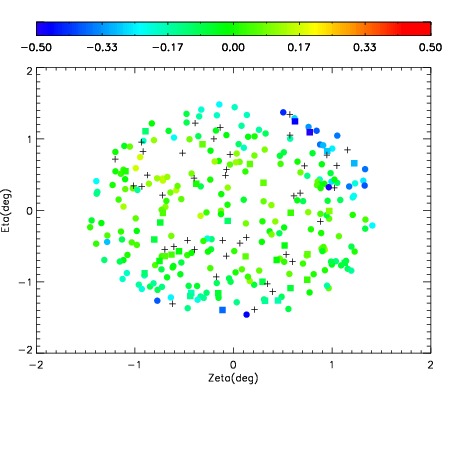
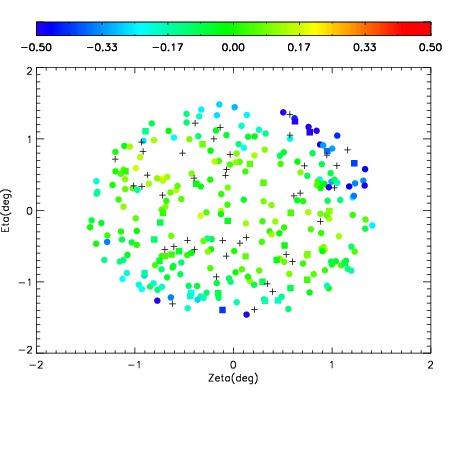
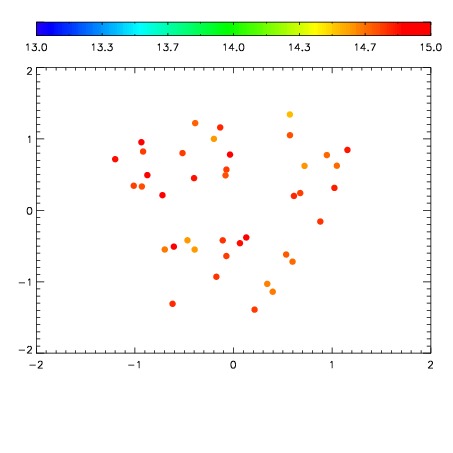
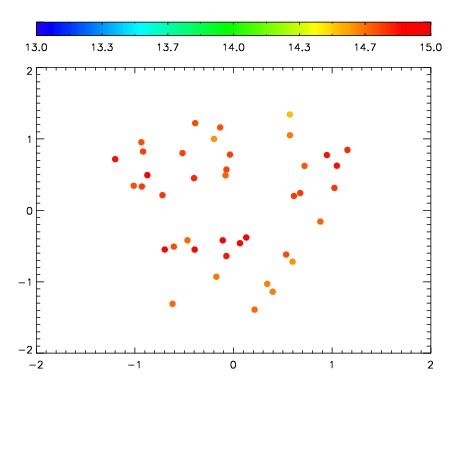
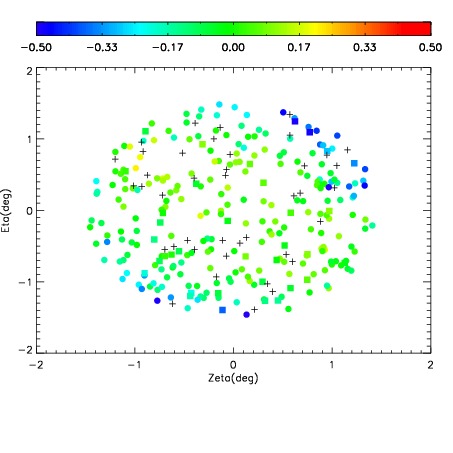
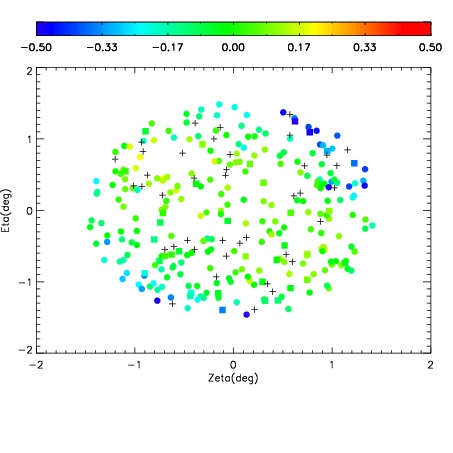
| Spatial mag deviation
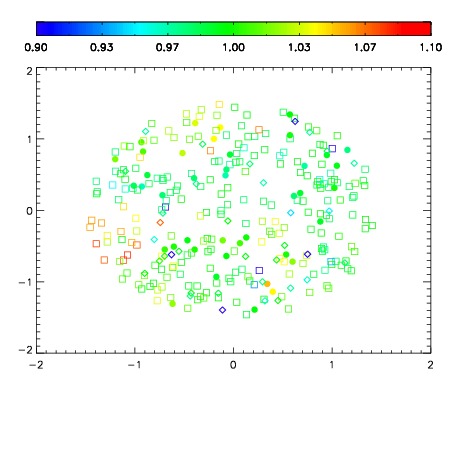
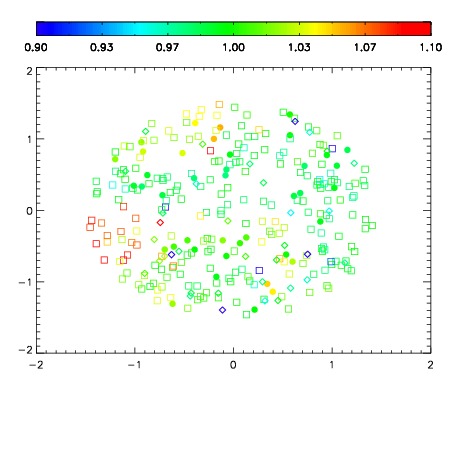
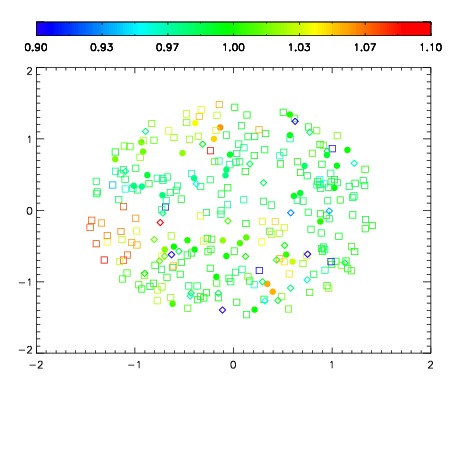
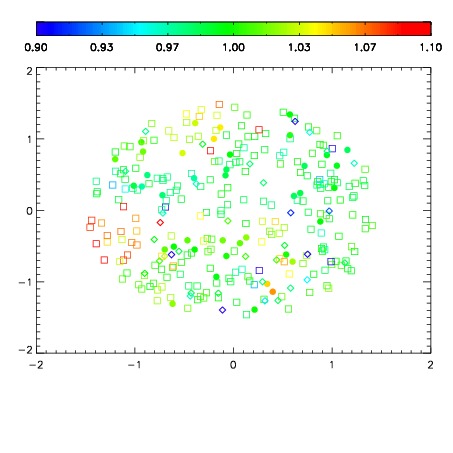
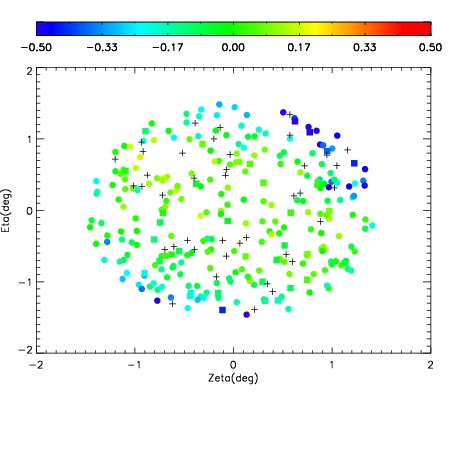
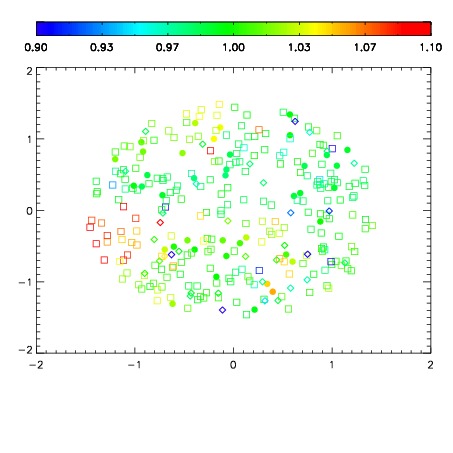
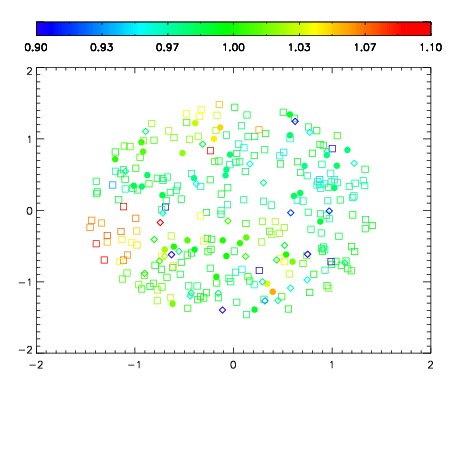
| Spatial sky 16325A emission deviations (filled: sky, open: star)
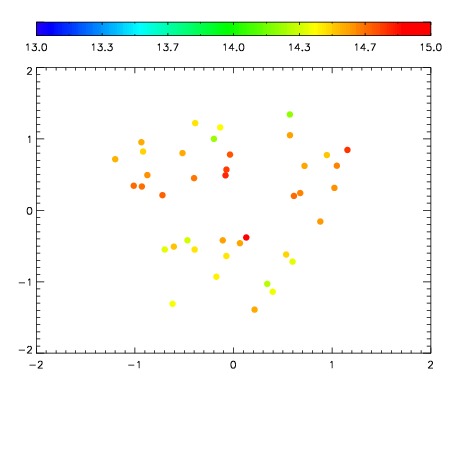
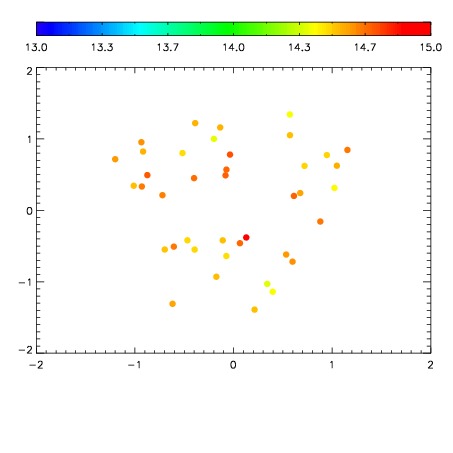
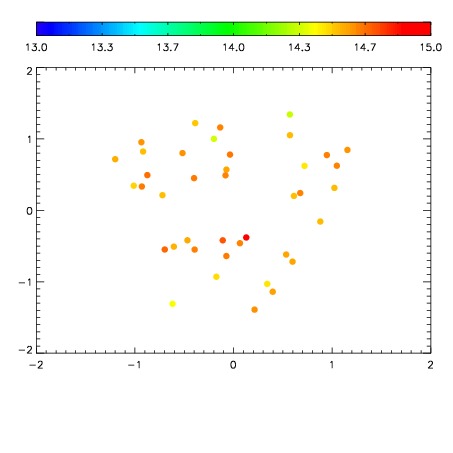
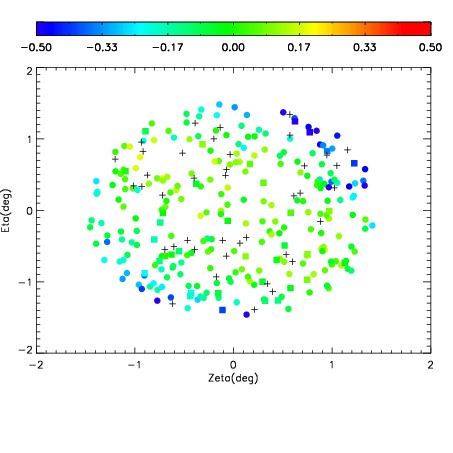
| Spatial sky continuum emission
| Spatial sky telluric CO2 absorption deviations (filled: H < 10)
|
| 5210070
| 47
| | Red | Green | Blue
| | z | | 18.33
| | znorm | | 14.15
| | sky | 15.0 | 14.6 | 14.5
| | S/N | 8.7 | 15.6 | 16.4
| | S/N(c) | 7.5 | 13.9 | 15.0
| | SN(E/C) 0.96
|
| 
| 
| 
| 
| 
|
| 5210071
| 47
| | Red | Green | Blue
| | z | | 18.43
| | znorm | | 14.25
| | sky | 14.8 | 14.6 | 14.9
| | S/N | 9.4 | 16.4 | 17.5
| | S/N(c) | 8.0 | 14.7 | 16.6
| | SN(E/C) 0.95
|
| 
| 
| 
| 
| 
|
| 5210072
| 47
| | Red | Green | Blue
| | z | | 18.58
| | znorm | | 14.40
| | sky | 14.9 | 14.7 | 15.0
| | S/N | 10.2 | 17.6 | 18.2
| | S/N(c) | 8.9 | 15.8 | 17.2
| | SN(E/C) 0.95
|
| 
| 
| 
| 
| 
|
| 5210073
| 47
| | Red | Green | Blue
| | z | | 18.74
| | znorm | | 14.56
| | sky | 15.0 | 14.8 | 15.0
| | S/N | 11.0 | 19.0 | 19.7
| | S/N(c) | 9.5 | 17.0 | 18.3
| | SN(E/C) 0.96
|
| 
| 
| 
| 
| 
|
| 5210074
| 47
| | Red | Green | Blue
| | z | | 18.83
| | znorm | | 14.65
| | sky | 14.8 | 14.8 | 15.0
| | S/N | 11.9 | 20.0 | 20.9
| | S/N(c) | 10.3 | 18.0 | 19.3
| | SN(E/C) 0.94
|
| 
| 
| 
| 
| 
|
| 5210075
| 47
| | Red | Green | Blue
| | z | | 18.67
| | znorm | | 14.49
| | sky | 14.6 | 14.6 | 14.7
| | S/N | 11.1 | 18.8 | 19.4
| | S/N(c) | 9.7 | 16.8 | 17.8
| | SN(E/C) 0.97
|
| 
| 
| 
| 
| 
|
| 5210076
| 47
| | Red | Green | Blue
| | z | | 18.73
| | znorm | | 14.55
| | sky | 14.9 | 14.7 | 14.9
| | S/N | 11.6 | 19.6 | 20.4
| | S/N(c) | 10.1 | 17.6 | 18.7
| | SN(E/C) 0.93
|
| 
| 
| 
| 
| 
|
| 5210077
| 47
| | Red | Green | Blue
| | z | | 18.86
| | znorm | | 14.67
| | sky | 14.9 | 14.6 | 14.8
| | S/N | 12.4 | 20.7 | 21.4
| | S/N(c) | 10.8 | 18.5 | 19.8
| | SN(E/C) 0.94
|
| 
| 
| 
| 
| 
|

