| Red | Green | Blue | |
| z | 17.64 | ||
| znorm | Inf | ||
| sky | -NaN | -Inf | -Inf |
| S/N | 18.7 | 33.0 | 35.9 |
| S/N(c) | 0.0 | 0.0 | 0.0 |
| SN(E/C) |

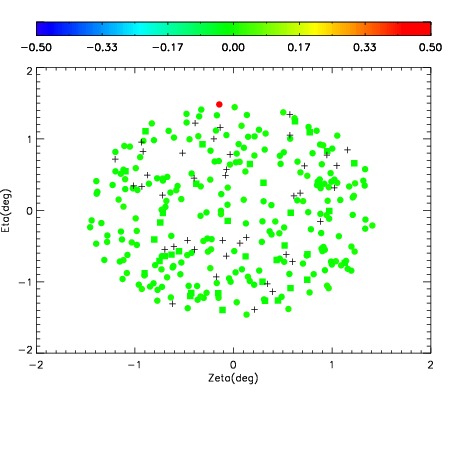
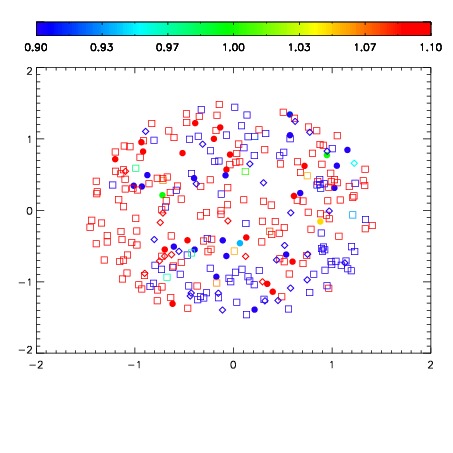

| Frame | Nreads | Zeropoints | Mag plots | Spatial mag deviation | Spatial sky 16325A emission deviations (filled: sky, open: star) | Spatial sky continuum emission | Spatial sky telluric CO2 absorption deviations (filled: H < 10) | |||||||||||||||||||||||
| 0 | 0 |
|
|
|
|
|
|
| IPAIR | NAME | SHIFT | NEWSHIFT | S/N | NAME | SHIFT | NEWSHIFT | S/N |
| 0 | 05210072 | 0.494119 | 0.00000 | 171.204 | 05210073 | -0.00357184 | 0.497691 | 185.517 |
| 1 | 05210076 | 0.490620 | 0.00349900 | 186.672 | 05210077 | -0.00420322 | 0.498322 | 197.643 |
| 2 | 05210075 | 0.490110 | 0.00400898 | 180.329 | 05210074 | -0.00399776 | 0.498117 | 193.350 |
| 3 | 05210071 | 0.492660 | 0.00145900 | 160.146 | 05210070 | 0.00000 | 0.494119 | 151.918 |