| Red | Green | Blue | |
| z | 17.64 | ||
| znorm | Inf | ||
| sky | -Inf | -Inf | -Inf |
| S/N | 23.2 | 40.1 | 40.4 |
| S/N(c) | 0.0 | 0.0 | 0.0 |
| SN(E/C) |
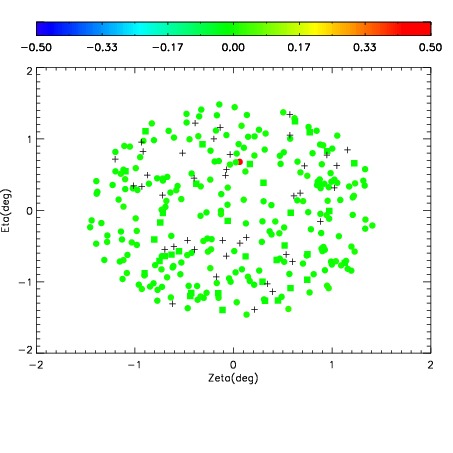
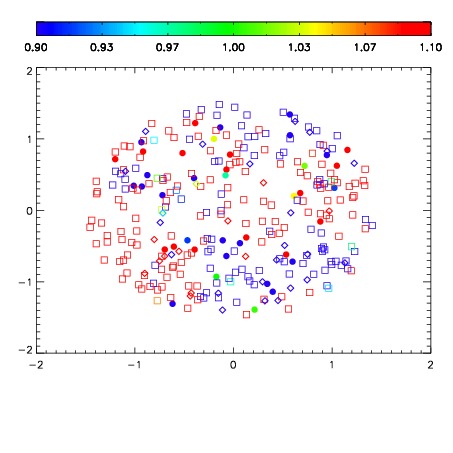


| Frame | Nreads | Zeropoints | Mag plots | Spatial mag deviation | Spatial sky 16325A emission deviations (filled: sky, open: star) | Spatial sky continuum emission | Spatial sky telluric CO2 absorption deviations (filled: H < 10) | |||||||||||||||||||||||
| 0 | 0 |
|
|
|
|
|
|
| IPAIR | NAME | SHIFT | NEWSHIFT | S/N | NAME | SHIFT | NEWSHIFT | S/N |
| 0 | 06060016 | 0.485812 | 0.00000 | 180.079 | 06060013 | 0.000502317 | 0.485310 | 192.833 |
| 1 | 06060011 | 0.482473 | 0.00333902 | 199.919 | 06060010 | 0.00000 | 0.485812 | 201.057 |
| 2 | 06060015 | 0.485101 | 0.000710994 | 198.715 | 06060014 | 0.000881923 | 0.484930 | 197.399 |
| 3 | 06060012 | 0.483304 | 0.00250801 | 189.058 | 06060017 | 0.00418851 | 0.481624 | 196.113 |