| Red | Green | Blue | |
| z | 17.64 | ||
| znorm | Inf | ||
| sky | -Inf | -Inf | -Inf |
| S/N | 20.8 | 38.2 | 40.5 |
| S/N(c) | 0.0 | 0.0 | 0.0 |
| SN(E/C) |

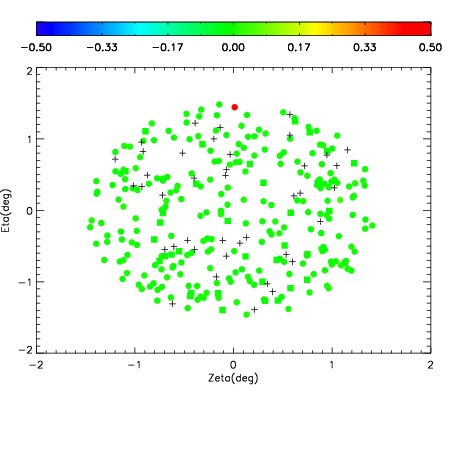
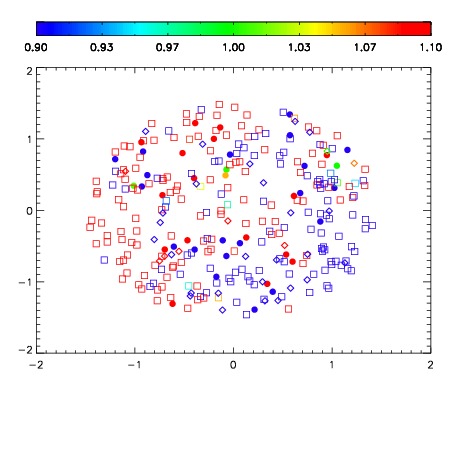
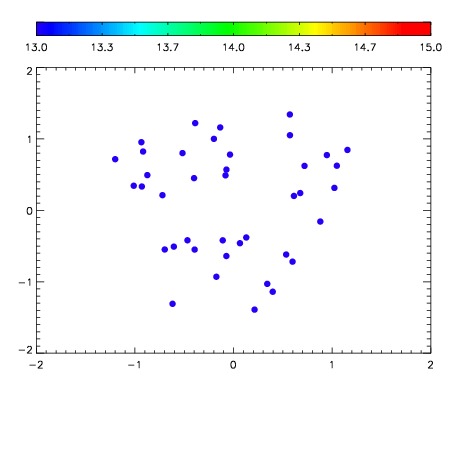

| Frame | Nreads | Zeropoints | Mag plots | Spatial mag deviation | Spatial sky 16325A emission deviations (filled: sky, open: star) | Spatial sky continuum emission | Spatial sky telluric CO2 absorption deviations (filled: H < 10) | |||||||||||||||||||||||
| 0 | 0 |
|
|
|
|
|
|
| IPAIR | NAME | SHIFT | NEWSHIFT | S/N | NAME | SHIFT | NEWSHIFT | S/N |
| 0 | 06080027 | 0.482148 | 0.00000 | 188.359 | 06080029 | 0.000477334 | 0.481671 | 188.382 |
| 1 | 06080031 | 0.480529 | 0.00161898 | 194.152 | 06080032 | 0.000629243 | 0.481519 | 196.589 |
| 2 | 06080030 | 0.480152 | 0.00199598 | 190.977 | 06080028 | 0.000628463 | 0.481520 | 189.222 |
| 3 | 06080026 | 0.481156 | 0.000992000 | 179.470 | 06080025 | 0.00000 | 0.482148 | 176.628 |