| Red | Green | Blue | |
| z | 17.64 | ||
| znorm | Inf | ||
| sky | -Inf | -Inf | -Inf |
| S/N | 22.0 | 39.1 | 41.0 |
| S/N(c) | 0.0 | 0.0 | 0.0 |
| SN(E/C) |
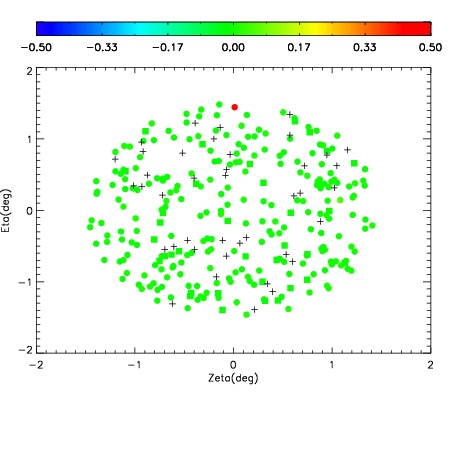
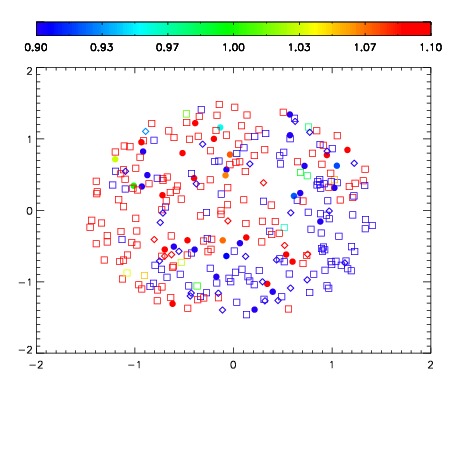
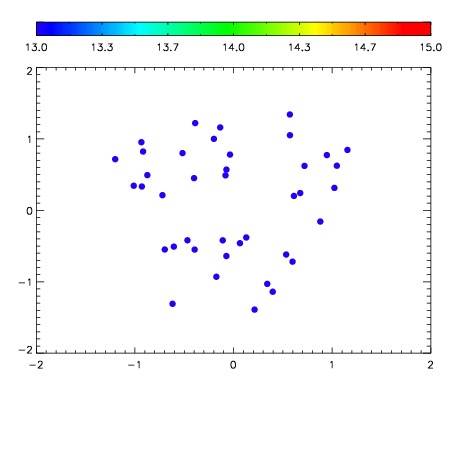

| Frame | Nreads | Zeropoints | Mag plots | Spatial mag deviation | Spatial sky 16325A emission deviations (filled: sky, open: star) | Spatial sky continuum emission | Spatial sky telluric CO2 absorption deviations (filled: H < 10) | |||||||||||||||||||||||
| 0 | 0 |
|
|
|
|
|
|
| IPAIR | NAME | SHIFT | NEWSHIFT | S/N | NAME | SHIFT | NEWSHIFT | S/N |
| 0 | 06090026 | 0.477733 | 0.00000 | 195.915 | 06090025 | -6.59632e-06 | 0.477740 | 186.355 |
| 1 | 06090023 | 0.477416 | 0.000316978 | 199.489 | 06090024 | 0.000732842 | 0.477000 | 196.588 |
| 2 | 06090022 | 0.477373 | 0.000359982 | 197.886 | 06090028 | 0.000184368 | 0.477549 | 193.760 |
| 3 | 06090027 | 0.477514 | 0.000218987 | 196.482 | 06090021 | 0.00000 | 0.477733 | 190.482 |