| Red | Green | Blue | |
| z | 17.64 | ||
| znorm | Inf | ||
| sky | -Inf | -Inf | -Inf |
| S/N | 22.2 | 40.6 | 42.8 |
| S/N(c) | 0.0 | 0.0 | 0.0 |
| SN(E/C) |
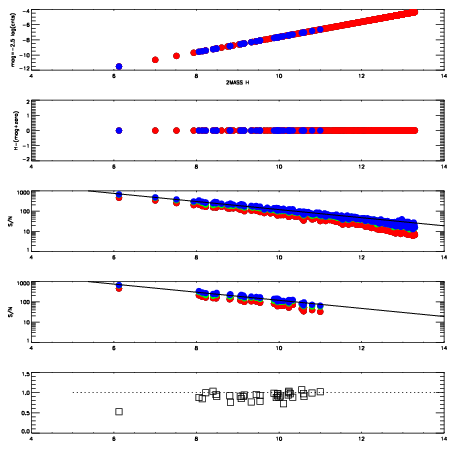
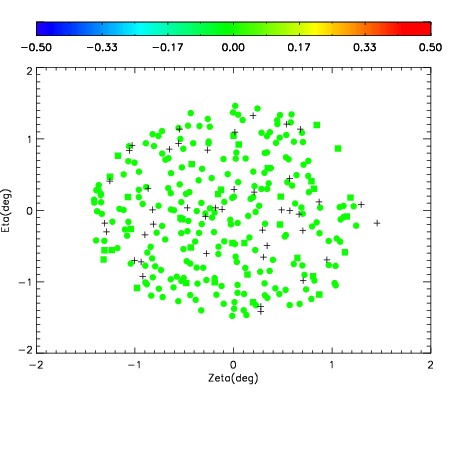
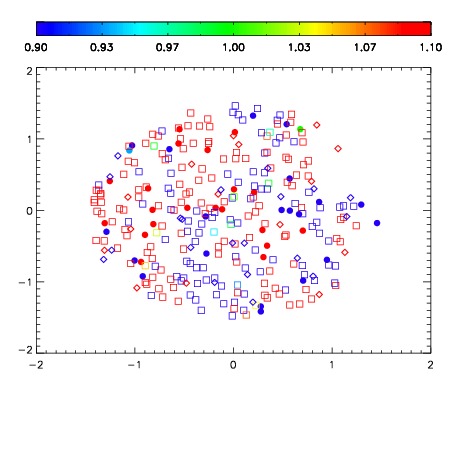
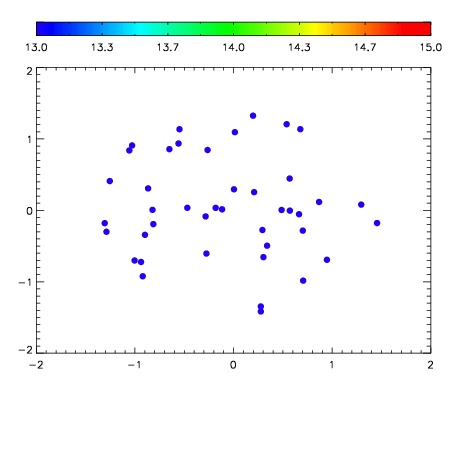

| Frame | Nreads | Zeropoints | Mag plots | Spatial mag deviation | Spatial sky 16325A emission deviations (filled: sky, open: star) | Spatial sky continuum emission | Spatial sky telluric CO2 absorption deviations (filled: H < 10) | |||||||||||||||||||||||
| 0 | 0 |
|
|
|
|
|
|
| IPAIR | NAME | SHIFT | NEWSHIFT | S/N | NAME | SHIFT | NEWSHIFT | S/N |
| 0 | 05450027 | 0.495246 | 0.00000 | 174.631 | 05450026 | 0.000479731 | 0.494766 | 169.130 |
| 1 | 05450024 | 0.492096 | 0.00314999 | 188.112 | 05450025 | 0.00117495 | 0.494071 | 187.679 |
| 2 | 05450028 | 0.495217 | 2.89977e-05 | 175.239 | 05450029 | 0.000966546 | 0.494279 | 177.816 |
| 3 | 05450023 | 0.492064 | 0.00318199 | 154.966 | 05450022 | 0.00000 | 0.495246 | 149.534 |