| Red | Green | Blue | |
| z | 17.64 | ||
| znorm | Inf | ||
| sky | -NaN | -Inf | -Inf |
| S/N | 25.6 | 44.2 | 46.7 |
| S/N(c) | 0.0 | 0.0 | 0.0 |
| SN(E/C) |
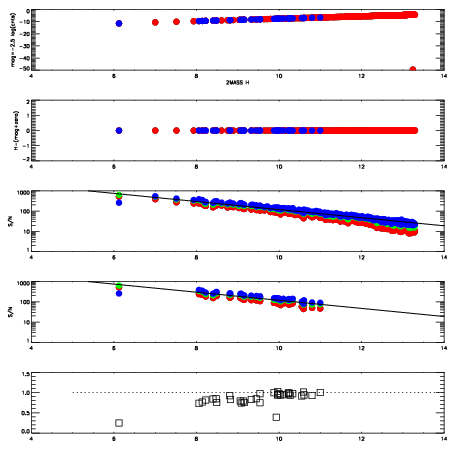
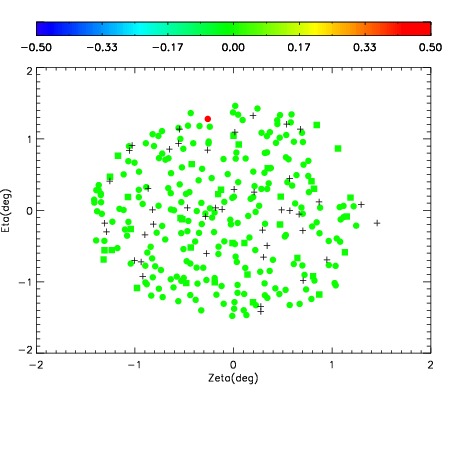
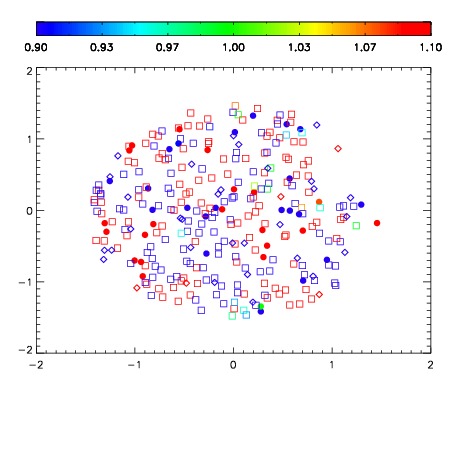
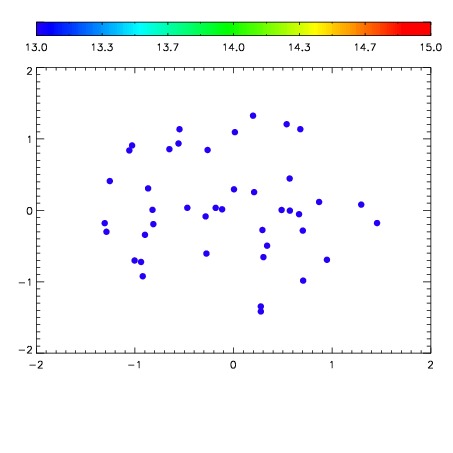

| Frame | Nreads | Zeropoints | Mag plots | Spatial mag deviation | Spatial sky 16325A emission deviations (filled: sky, open: star) | Spatial sky continuum emission | Spatial sky telluric CO2 absorption deviations (filled: H < 10) | |||||||||||||||||||||||
| 0 | 0 |
|
|
|
|
|
|
| IPAIR | NAME | SHIFT | NEWSHIFT | S/N | NAME | SHIFT | NEWSHIFT | S/N |
| 0 | 06320027 | 0.475174 | 0.00000 | 142.677 | 06320026 | 0.00000 | 0.475174 | 114.968 |
| 1 | 06320032 | 0.474639 | 0.000535011 | 215.774 | 06320033 | -0.00468305 | 0.479857 | 214.252 |
| 2 | 06320031 | 0.473138 | 0.00203601 | 212.028 | 06320030 | -0.00377674 | 0.478951 | 200.181 |
| 3 | 06320028 | 0.474975 | 0.000199020 | 208.025 | 06320029 | 0.00658235 | 0.468592 | 176.340 |