| Red | Green | Blue | |
| z | 17.64 | ||
| znorm | Inf | ||
| sky | -NaN | -Inf | -Inf |
| S/N | 31.3 | 52.9 | 55.6 |
| S/N(c) | 0.0 | 0.0 | 0.0 |
| SN(E/C) |
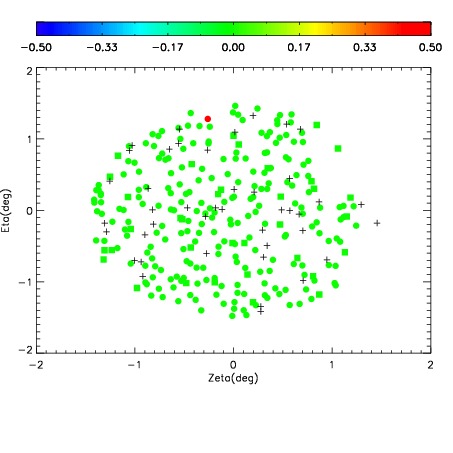
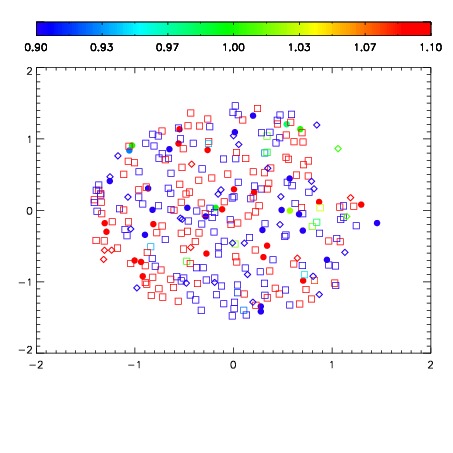
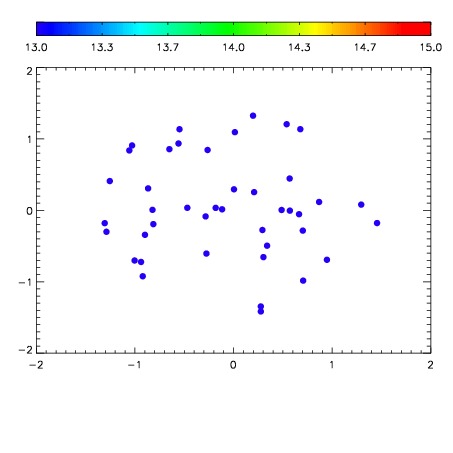

| Frame | Nreads | Zeropoints | Mag plots | Spatial mag deviation | Spatial sky 16325A emission deviations (filled: sky, open: star) | Spatial sky continuum emission | Spatial sky telluric CO2 absorption deviations (filled: H < 10) | |||||||||||||||||||||||
| 0 | 0 |
|
|
|
|
|
|
| IPAIR | NAME | SHIFT | NEWSHIFT | S/N | NAME | SHIFT | NEWSHIFT | S/N |
| 0 | 06380013 | 0.474499 | 0.00000 | 208.341 | 06380014 | 0.00426262 | 0.470236 | 204.902 |
| 1 | 06380017 | 0.473098 | 0.00140098 | 213.945 | 06380018 | -0.00407271 | 0.478572 | 215.417 |
| 2 | 06380016 | 0.473160 | 0.00133899 | 212.322 | 06380015 | 0.00959165 | 0.464907 | 212.393 |
| 3 | 06380012 | 0.474097 | 0.000401974 | 211.003 | 06380011 | 0.00000 | 0.474499 | 208.933 |