| Red | Green | Blue | |
| z | 17.64 | ||
| znorm | Inf | ||
| sky | -Inf | -Inf | -Inf |
| S/N | 30.9 | 52.7 | 54.4 |
| S/N(c) | 0.0 | 0.0 | 0.0 |
| SN(E/C) |
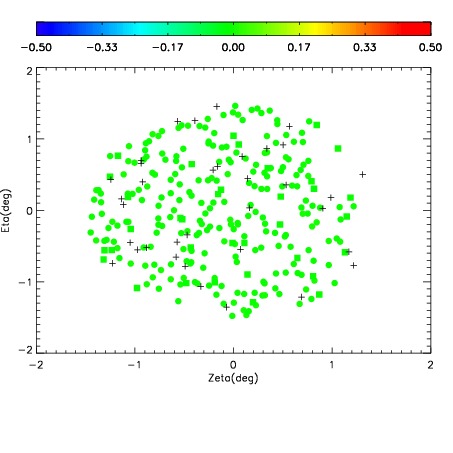
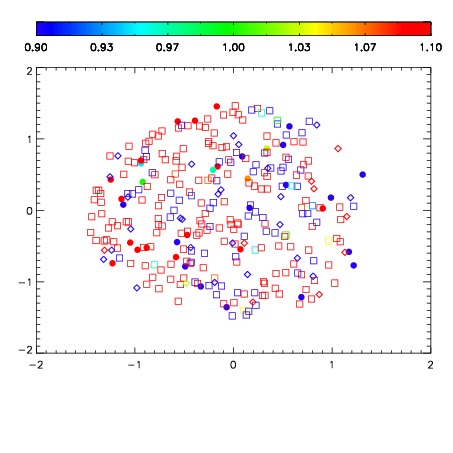
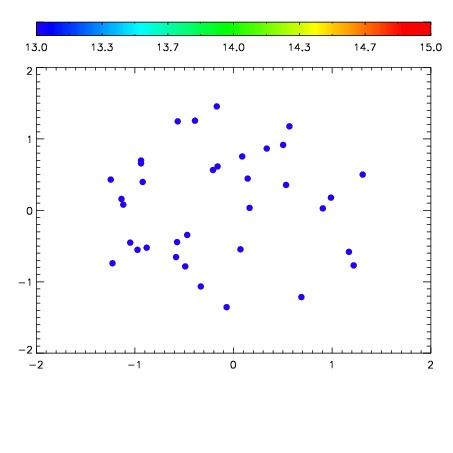

| Frame | Nreads | Zeropoints | Mag plots | Spatial mag deviation | Spatial sky 16325A emission deviations (filled: sky, open: star) | Spatial sky continuum emission | Spatial sky telluric CO2 absorption deviations (filled: H < 10) | |||||||||||||||||||||||
| 0 | 0 |
|
|
|
|
|
|
| IPAIR | NAME | SHIFT | NEWSHIFT | S/N | NAME | SHIFT | NEWSHIFT | S/N |
| 0 | 06340027 | 0.476640 | 0.00000 | 244.395 | 06340022 | 0.00000 | 0.476640 | 257.589 |
| 1 | 06340024 | 0.476394 | 0.000245988 | 259.921 | 06340025 | 0.00686507 | 0.469775 | 259.714 |
| 2 | 06340023 | 0.476343 | 0.000296980 | 259.505 | 06340029 | 0.0103895 | 0.466250 | 259.482 |
| 3 | 06340028 | 0.476495 | 0.000144988 | 253.901 | 06340026 | 0.00413661 | 0.472503 | 258.202 |