| Red | Green | Blue | |
| z | 17.64 | ||
| znorm | Inf | ||
| sky | -Inf | -Inf | -Inf |
| S/N | 29.9 | 50.1 | 53.1 |
| S/N(c) | 0.0 | 0.0 | 0.0 |
| SN(E/C) |

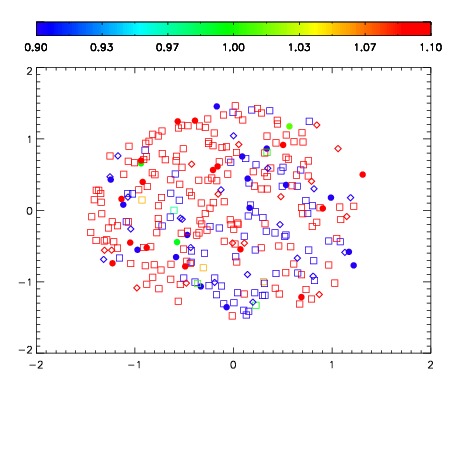
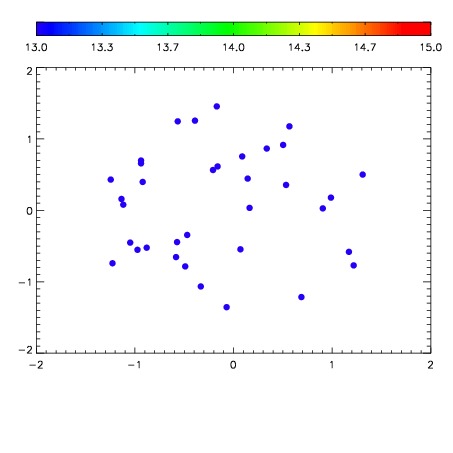

| Frame | Nreads | Zeropoints | Mag plots | Spatial mag deviation | Spatial sky 16325A emission deviations (filled: sky, open: star) | Spatial sky continuum emission | Spatial sky telluric CO2 absorption deviations (filled: H < 10) | |||||||||||||||||||||||
| 0 | 0 |
|
|
|
|
|
|
| IPAIR | NAME | SHIFT | NEWSHIFT | S/N | NAME | SHIFT | NEWSHIFT | S/N |
| 0 | 06610015 | 0.470941 | 0.00000 | 248.243 | 06610014 | 0.00168596 | 0.469255 | 245.030 |
| 1 | 06610016 | 0.470681 | 0.000259995 | 253.570 | 06610017 | -0.00180055 | 0.472742 | 249.804 |
| 2 | 06610012 | 0.470070 | 0.000871003 | 236.705 | 06610013 | 0.00411412 | 0.466827 | 240.952 |
| 3 | 06610011 | 0.470549 | 0.000392020 | 235.004 | 06610010 | 0.00000 | 0.470941 | 229.565 |