| Red | Green | Blue | |
| z | 17.64 | ||
| znorm | Inf | ||
| sky | -NaN | -NaN | -Inf |
| S/N | 20.2 | 36.0 | 37.7 |
| S/N(c) | 0.0 | 0.0 | 0.0 |
| SN(E/C) |
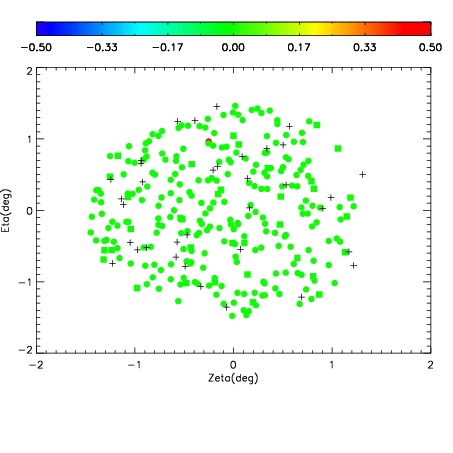
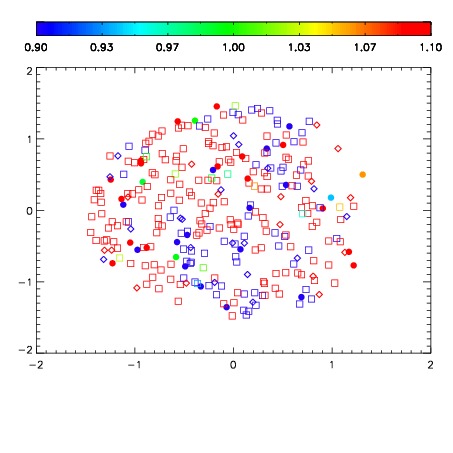
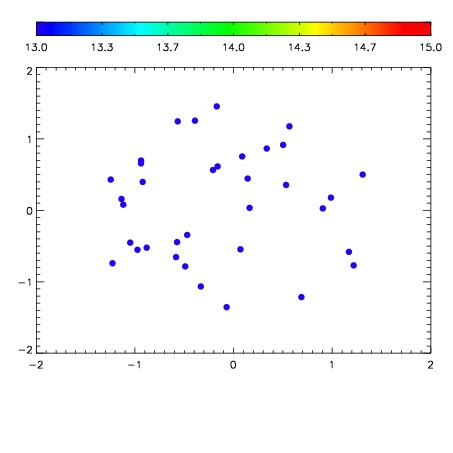

| Frame | Nreads | Zeropoints | Mag plots | Spatial mag deviation | Spatial sky 16325A emission deviations (filled: sky, open: star) | Spatial sky continuum emission | Spatial sky telluric CO2 absorption deviations (filled: H < 10) | |||||||||||||||||||||||
| 0 | 0 |
|
|
|
|
|
|
| IPAIR | NAME | SHIFT | NEWSHIFT | S/N | NAME | SHIFT | NEWSHIFT | S/N |
| 0 | 06650013 | 0.486013 | 0.00000 | 183.947 | 06650018 | -0.00222375 | 0.488237 | 178.690 |
| 1 | 06650012 | 0.485748 | 0.000265002 | 166.814 | 06650015 | -0.00582619 | 0.491839 | 176.786 |
| 2 | 06650017 | 0.485137 | 0.000876009 | 164.207 | 06650014 | -0.00303809 | 0.489051 | 171.316 |
| 3 | 06650016 | 0.484541 | 0.00147200 | 160.898 | 06650011 | 0.00000 | 0.486013 | 146.387 |