| Red | Green | Blue | |
| z | 17.64 | ||
| znorm | Inf | ||
| sky | -Inf | -Inf | -NaN |
| S/N | 28.3 | 45.7 | 47.2 |
| S/N(c) | 0.0 | 0.0 | 0.0 |
| SN(E/C) |
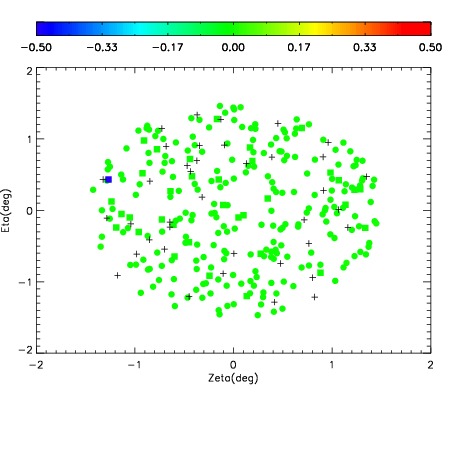
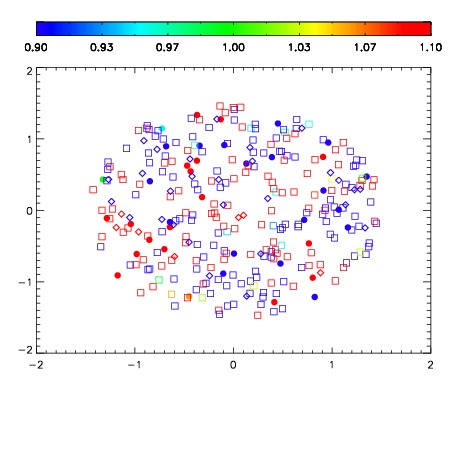
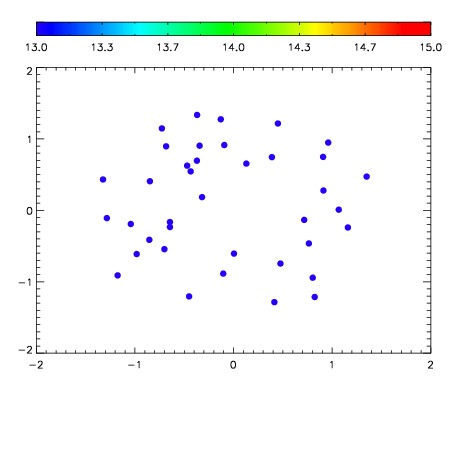

| Frame | Nreads | Zeropoints | Mag plots | Spatial mag deviation | Spatial sky 16325A emission deviations (filled: sky, open: star) | Spatial sky continuum emission | Spatial sky telluric CO2 absorption deviations (filled: H < 10) | |||||||||||||||||||||||
| 0 | 0 |
|
|
|
|
|
|
| IPAIR | NAME | SHIFT | NEWSHIFT | S/N | NAME | SHIFT | NEWSHIFT | S/N |
| 0 | 05280017 | 0.488358 | 0.00000 | 213.291 | 05280015 | 0.00157467 | 0.486783 | 203.533 |
| 1 | 05280016 | 0.488057 | 0.000301003 | 210.542 | 05280018 | 0.00161990 | 0.486738 | 201.598 |
| 2 | 05280012 | 0.485636 | 0.00272200 | 186.245 | 05280014 | -0.00123154 | 0.489590 | 195.214 |
| 3 | 05280013 | 0.485986 | 0.00237200 | 183.905 | 05280011 | 0.00000 | 0.488358 | 176.841 |