| Red | Green | Blue | |
| z | 17.64 | ||
| znorm | Inf | ||
| sky | -Inf | -Inf | -Inf |
| S/N | 24.7 | 43.7 | 47.1 |
| S/N(c) | 0.0 | 0.0 | 0.0 |
| SN(E/C) |
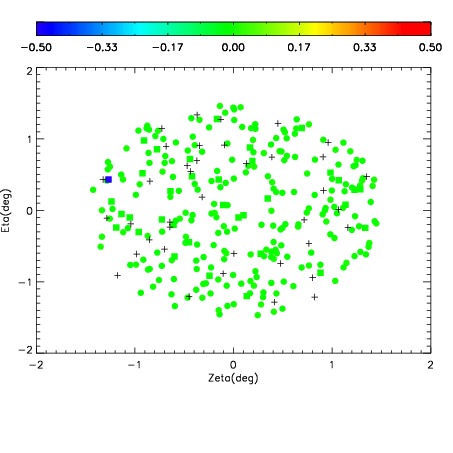
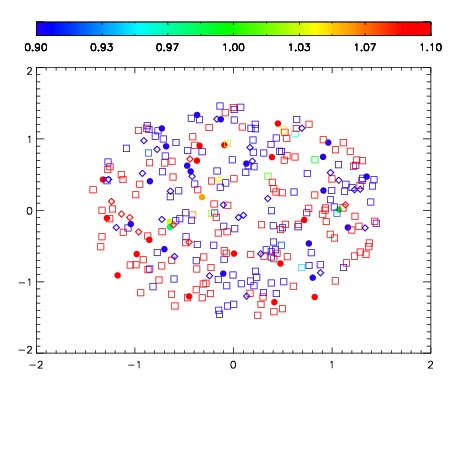
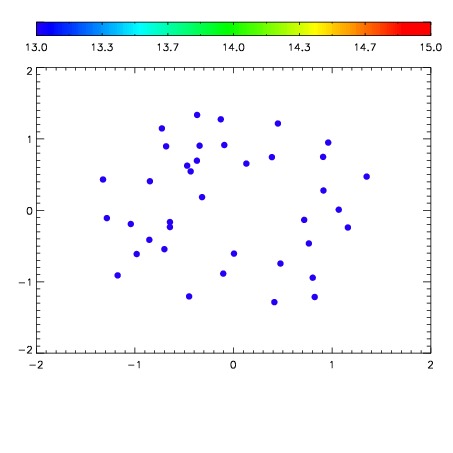

| Frame | Nreads | Zeropoints | Mag plots | Spatial mag deviation | Spatial sky 16325A emission deviations (filled: sky, open: star) | Spatial sky continuum emission | Spatial sky telluric CO2 absorption deviations (filled: H < 10) | |||||||||||||||||||||||
| 0 | 0 |
|
|
|
|
|
|
| IPAIR | NAME | SHIFT | NEWSHIFT | S/N | NAME | SHIFT | NEWSHIFT | S/N |
| 0 | 05480064 | 0.489339 | 0.00000 | 195.496 | 05480065 | 0.00506199 | 0.484277 | 198.909 |
| 1 | 05480060 | 0.488385 | 0.000954002 | 189.188 | 05480061 | 0.00262013 | 0.486719 | 194.459 |
| 2 | 05480063 | 0.488370 | 0.000968993 | 185.467 | 05480058 | 0.00000 | 0.489339 | 189.229 |
| 3 | 05480059 | 0.486327 | 0.00301200 | 180.560 | 05480062 | 0.00192224 | 0.487417 | 186.827 |