| Red | Green | Blue | |
| z | 17.64 | ||
| znorm | Inf | ||
| sky | -Inf | -Inf | -Inf |
| S/N | 29.4 | 49.3 | 50.8 |
| S/N(c) | 0.0 | 0.0 | 0.0 |
| SN(E/C) |
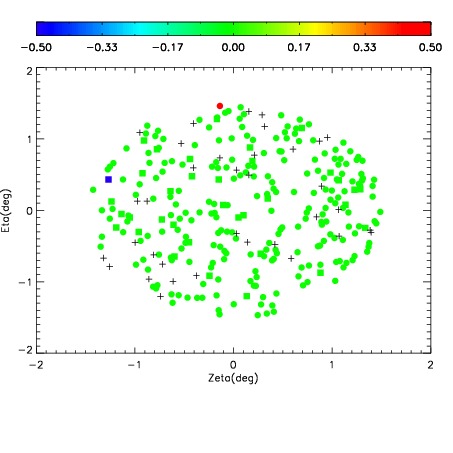
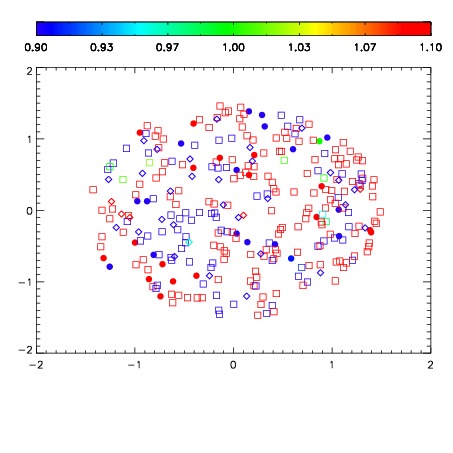
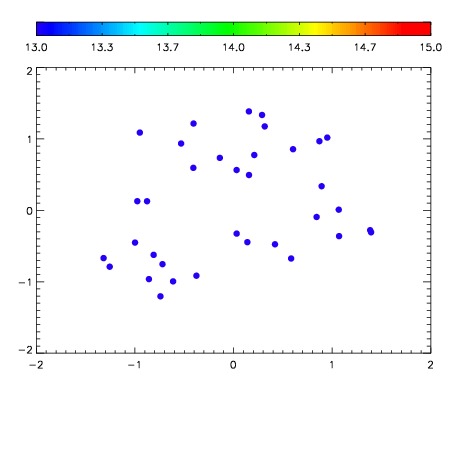

| Frame | Nreads | Zeropoints | Mag plots | Spatial mag deviation | Spatial sky 16325A emission deviations (filled: sky, open: star) | Spatial sky continuum emission | Spatial sky telluric CO2 absorption deviations (filled: H < 10) | |||||||||||||||||||||||
| 0 | 0 |
|
|
|
|
|
|
| IPAIR | NAME | SHIFT | NEWSHIFT | S/N | NAME | SHIFT | NEWSHIFT | S/N |
| 0 | 02830014 | 0.412061 | 0.00000 | 237.459 | 02830015 | 0.00103077 | 0.411030 | 234.507 |
| 1 | 02830010 | 0.411387 | 0.000674009 | 240.138 | 02830008 | 0.00000 | 0.412061 | 237.810 |
| 2 | 02830009 | 0.410138 | 0.00192299 | 239.034 | 02830012 | 4.53828e-05 | 0.412016 | 236.810 |
| 3 | 02830013 | 0.410788 | 0.00127301 | 238.178 | 02830011 | 0.00183767 | 0.410223 | 236.082 |