| Red | Green | Blue | |
| z | 17.64 | ||
| znorm | Inf | ||
| sky | -Inf | -Inf | -Inf |
| S/N | 26.8 | 46.1 | 52.3 |
| S/N(c) | 0.0 | 0.0 | 0.0 |
| SN(E/C) |
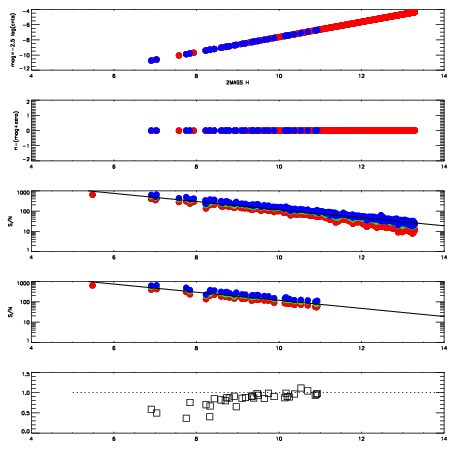
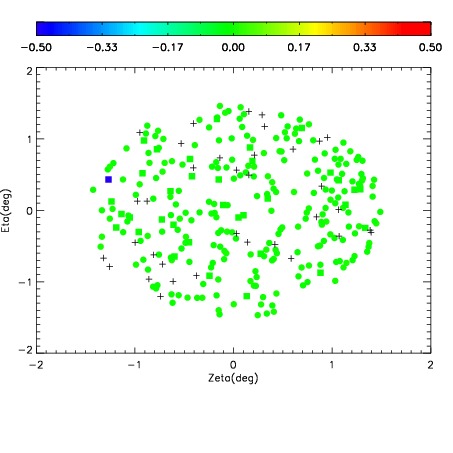
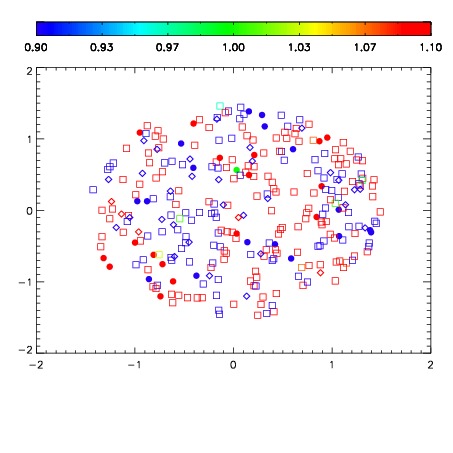
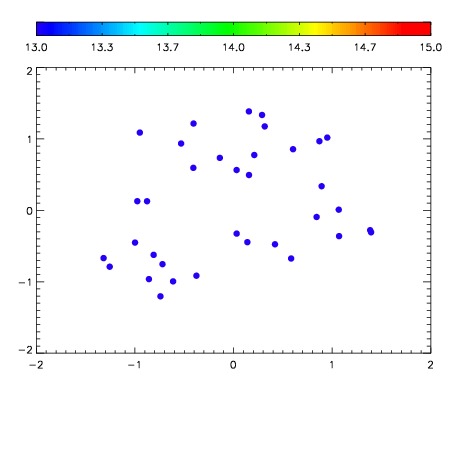

| Frame | Nreads | Zeropoints | Mag plots | Spatial mag deviation | Spatial sky 16325A emission deviations (filled: sky, open: star) | Spatial sky continuum emission | Spatial sky telluric CO2 absorption deviations (filled: H < 10) | |||||||||||||||||||||||
| 0 | 0 |
|
|
|
|
|
|
| IPAIR | NAME | SHIFT | NEWSHIFT | S/N | NAME | SHIFT | NEWSHIFT | S/N |
| 0 | 06310028 | 0.481693 | 0.00000 | 201.525 | 06310033 | 0.00482551 | 0.476867 | 195.780 |
| 1 | 06310027 | 0.481207 | 0.000485986 | 205.141 | 06310026 | 0.00000 | 0.481693 | 201.489 |
| 2 | 06310032 | 0.479945 | 0.00174800 | 194.478 | 06310030 | 0.00203812 | 0.479655 | 188.330 |
| 3 | 06310031 | 0.478622 | 0.00307101 | 192.266 | 06310029 | 0.00242167 | 0.479271 | 188.035 |