| Red | Green | Blue | |
| z | 17.64 | ||
| znorm | Inf | ||
| sky | -Inf | -Inf | -Inf |
| S/N | 27.6 | 47.8 | 52.2 |
| S/N(c) | 0.0 | 0.0 | 0.0 |
| SN(E/C) |
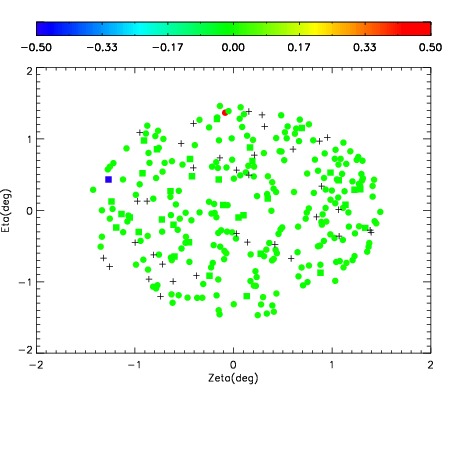
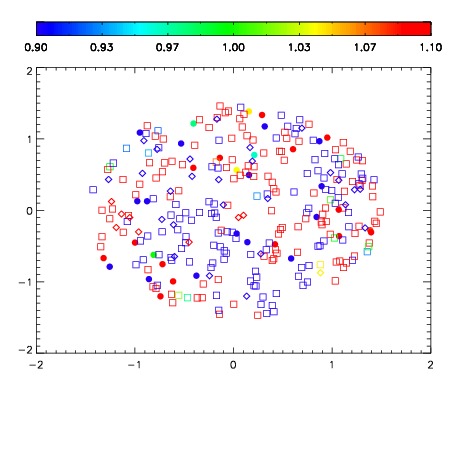
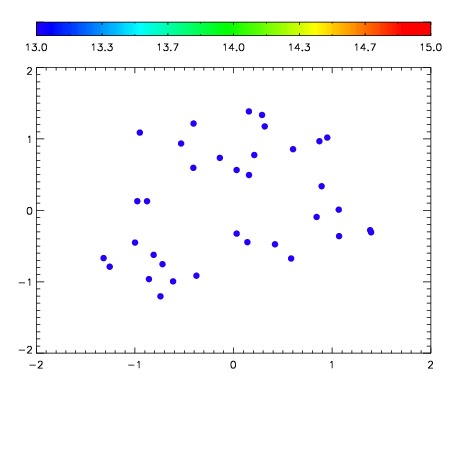

| Frame | Nreads | Zeropoints | Mag plots | Spatial mag deviation | Spatial sky 16325A emission deviations (filled: sky, open: star) | Spatial sky continuum emission | Spatial sky telluric CO2 absorption deviations (filled: H < 10) | |||||||||||||||||||||||
| 0 | 0 |
|
|
|
|
|
|
| IPAIR | NAME | SHIFT | NEWSHIFT | S/N | NAME | SHIFT | NEWSHIFT | S/N |
| 0 | 06590016 | 0.471885 | 0.00000 | 225.583 | 06590010 | 0.00000 | 0.471885 | 223.316 |
| 1 | 06590012 | 0.471118 | 0.000766993 | 229.878 | 06590013 | 0.000288359 | 0.471597 | 230.493 |
| 2 | 06590015 | 0.470998 | 0.000887007 | 228.290 | 06590014 | 0.00474537 | 0.467140 | 230.150 |
| 3 | 06590011 | 0.470990 | 0.000894994 | 227.097 | 06590017 | -0.00177766 | 0.473663 | 226.789 |