| Red | Green | Blue | |
| z | 17.64 | ||
| znorm | Inf | ||
| sky | -Inf | -Inf | -Inf |
| S/N | 28.9 | 50.8 | 56.3 |
| S/N(c) | 0.0 | 0.0 | 0.0 |
| SN(E/C) |
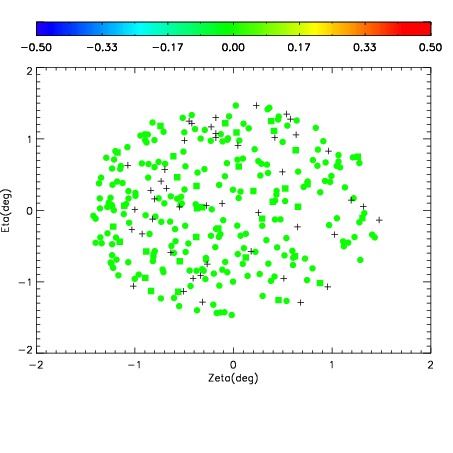
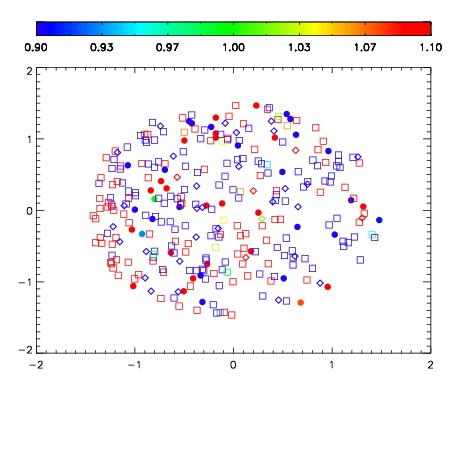
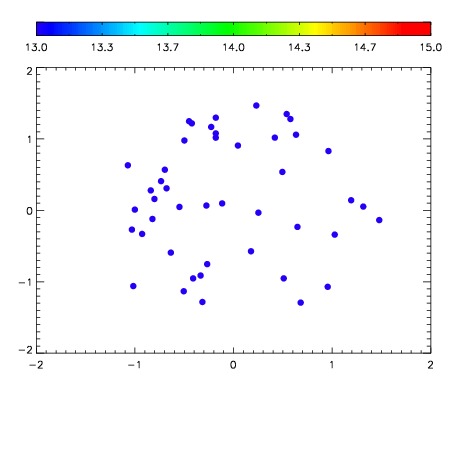

| Frame | Nreads | Zeropoints | Mag plots | Spatial mag deviation | Spatial sky 16325A emission deviations (filled: sky, open: star) | Spatial sky continuum emission | Spatial sky telluric CO2 absorption deviations (filled: H < 10) | |||||||||||||||||||||||
| 0 | 0 |
|
|
|
|
|
|
| IPAIR | NAME | SHIFT | NEWSHIFT | S/N | NAME | SHIFT | NEWSHIFT | S/N |
| 0 | 05230075 | 0.493975 | 0.00000 | 238.511 | 05230073 | 0.00124676 | 0.492728 | 239.353 |
| 1 | 05230071 | 0.491241 | 0.00273401 | 236.339 | 05230072 | 0.000313704 | 0.493661 | 238.419 |
| 2 | 05230074 | 0.492991 | 0.000984013 | 231.453 | 05230076 | -0.000212863 | 0.494188 | 238.260 |
| 3 | 05230070 | 0.490506 | 0.00346902 | 226.100 | 05230069 | 0.00000 | 0.493975 | 231.387 |