| Red | Green | Blue | |
| z | 17.64 | ||
| znorm | Inf | ||
| sky | -Inf | -Inf | -Inf |
| S/N | 27.0 | 48.6 | 52.7 |
| S/N(c) | 0.0 | 0.0 | 0.0 |
| SN(E/C) |
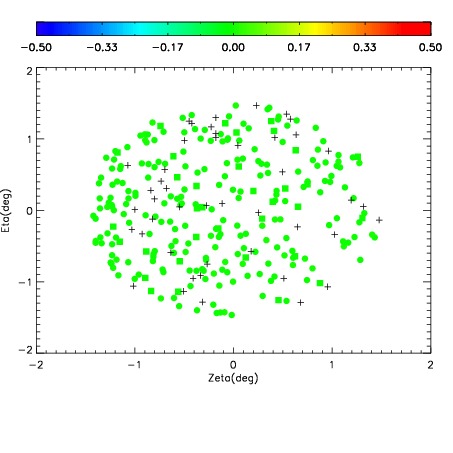
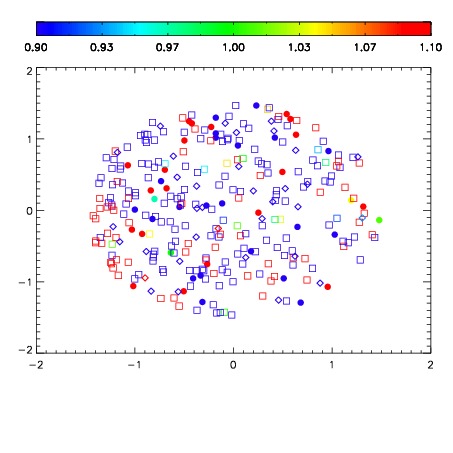
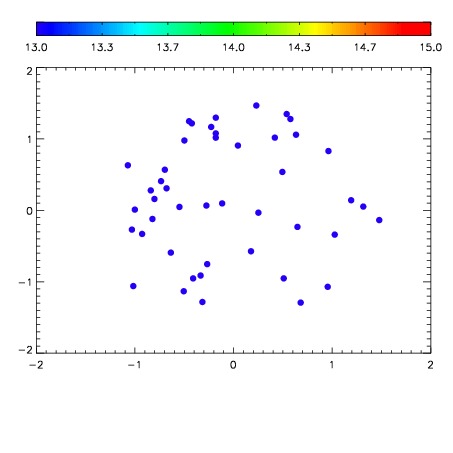

| Frame | Nreads | Zeropoints | Mag plots | Spatial mag deviation | Spatial sky 16325A emission deviations (filled: sky, open: star) | Spatial sky continuum emission | Spatial sky telluric CO2 absorption deviations (filled: H < 10) | |||||||||||||||||||||||
| 0 | 0 |
|
|
|
|
|
|
| IPAIR | NAME | SHIFT | NEWSHIFT | S/N | NAME | SHIFT | NEWSHIFT | S/N |
| 0 | 05270012 | 0.487640 | 0.00000 | 230.728 | 05270013 | -0.00150858 | 0.489149 | 229.493 |
| 1 | 05270015 | 0.485880 | 0.00176001 | 228.330 | 05270017 | -0.000247630 | 0.487888 | 226.211 |
| 2 | 05270016 | 0.486683 | 0.000956982 | 227.145 | 05270010 | 0.00000 | 0.487640 | 224.216 |
| 3 | 05270011 | 0.486710 | 0.000929981 | 226.953 | 05270014 | -0.000299496 | 0.487939 | 223.063 |