| Red | Green | Blue | |
| z | 17.64 | ||
| znorm | Inf | ||
| sky | -Inf | -Inf | -Inf |
| S/N | 23.0 | 41.9 | 44.9 |
| S/N(c) | 0.0 | 0.0 | 0.0 |
| SN(E/C) |

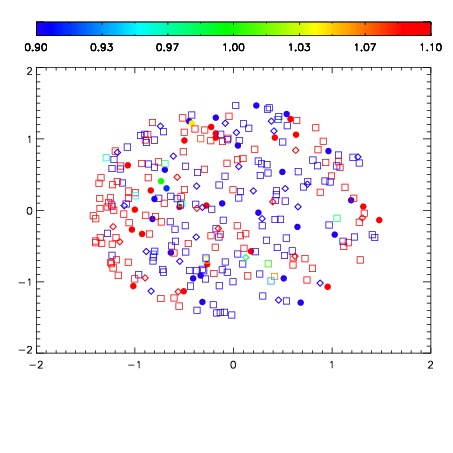
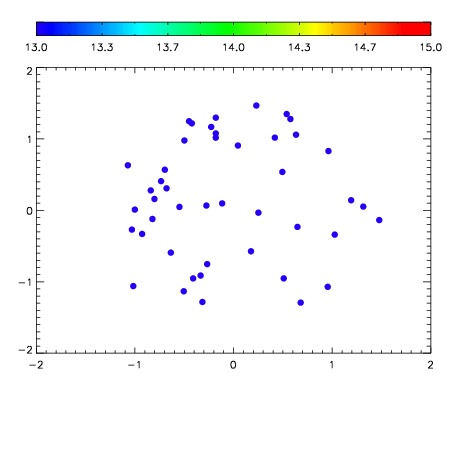

| Frame | Nreads | Zeropoints | Mag plots | Spatial mag deviation | Spatial sky 16325A emission deviations (filled: sky, open: star) | Spatial sky continuum emission | Spatial sky telluric CO2 absorption deviations (filled: H < 10) | |||||||||||||||||||||||
| 0 | 0 |
|
|
|
|
|
|
| IPAIR | NAME | SHIFT | NEWSHIFT | S/N | NAME | SHIFT | NEWSHIFT | S/N |
| 0 | 05490054 | 0.485081 | 0.00000 | 213.710 | 05490051 | -0.000817125 | 0.485898 | 214.650 |
| 1 | 05490049 | 0.481331 | 0.00375000 | 222.324 | 05490048 | 0.00000 | 0.485081 | 223.065 |
| 2 | 05490050 | 0.482422 | 0.00265899 | 216.874 | 05490055 | -6.14748e-05 | 0.485142 | 215.916 |
| 3 | 05490053 | 0.484866 | 0.000214994 | 212.701 | 05490052 | -0.00105718 | 0.486138 | 208.030 |