| Red | Green | Blue | |
| z | 17.64 | ||
| znorm | Inf | ||
| sky | -Inf | -Inf | -Inf |
| S/N | 28.6 | 50.3 | 52.4 |
| S/N(c) | 0.0 | 0.0 | 0.0 |
| SN(E/C) |
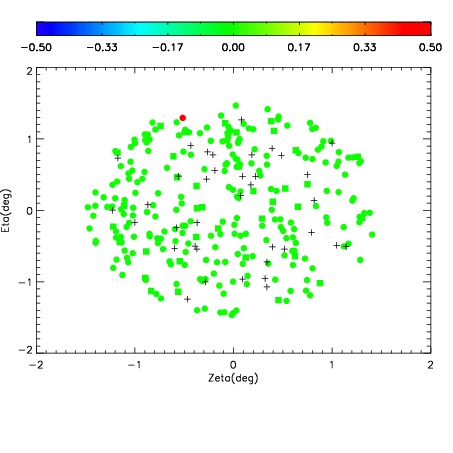
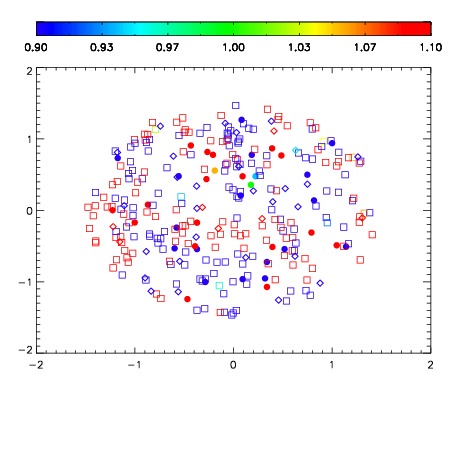
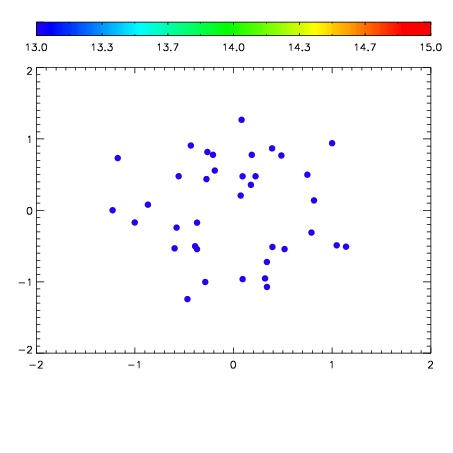

| Frame | Nreads | Zeropoints | Mag plots | Spatial mag deviation | Spatial sky 16325A emission deviations (filled: sky, open: star) | Spatial sky continuum emission | Spatial sky telluric CO2 absorption deviations (filled: H < 10) | |||||||||||||||||||||||
| 0 | 0 |
|
|
|
|
|
|
| IPAIR | NAME | SHIFT | NEWSHIFT | S/N | NAME | SHIFT | NEWSHIFT | S/N |
| 0 | 06100031 | 0.488879 | 0.00000 | 228.533 | 06100029 | 0.000355133 | 0.488524 | 227.393 |
| 1 | 06100030 | 0.488641 | 0.000238001 | 227.646 | 06100032 | 0.00226191 | 0.486617 | 226.258 |
| 2 | 06100026 | 0.487395 | 0.00148401 | 225.284 | 06100025 | 0.00000 | 0.488879 | 224.804 |
| 3 | 06100027 | 0.488338 | 0.000541002 | 216.991 | 06100028 | 0.00109080 | 0.487788 | 224.184 |