| Red | Green | Blue | |
| z | 17.64 | ||
| znorm | Inf | ||
| sky | -Inf | -Inf | -Inf |
| S/N | 20.9 | 38.1 | 40.0 |
| S/N(c) | 0.0 | 0.0 | 0.0 |
| SN(E/C) |
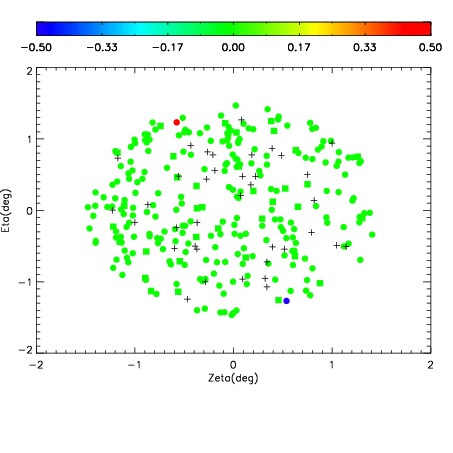
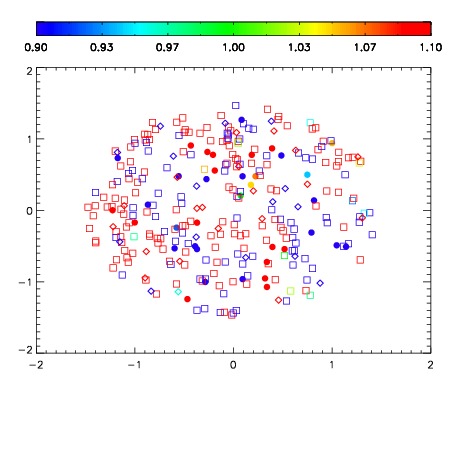
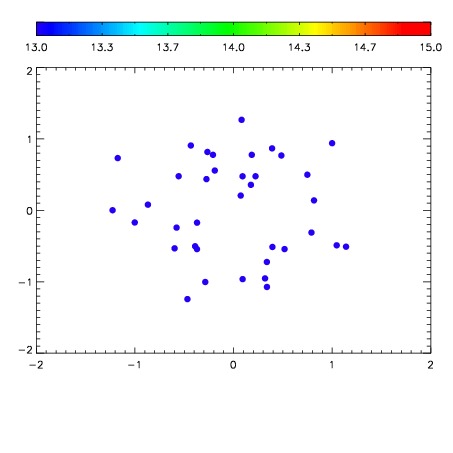

| Frame | Nreads | Zeropoints | Mag plots | Spatial mag deviation | Spatial sky 16325A emission deviations (filled: sky, open: star) | Spatial sky continuum emission | Spatial sky telluric CO2 absorption deviations (filled: H < 10) | |||||||||||||||||||||||
| 0 | 0 |
|
|
|
|
|
|
| IPAIR | NAME | SHIFT | NEWSHIFT | S/N | NAME | SHIFT | NEWSHIFT | S/N |
| 0 | 06640012 | 0.485059 | 0.00000 | 140.862 | 06640010 | 0.00000 | 0.485059 | 158.125 |
| 1 | 06640016 | 0.482613 | 0.00244600 | 223.425 | 06640017 | -0.00142523 | 0.486484 | 229.511 |
| 2 | 06640015 | 0.482056 | 0.00300300 | 202.030 | 06640014 | 1.60441e-05 | 0.485043 | 196.749 |
| 3 | 06640011 | 0.484572 | 0.000487000 | 145.299 | 06640013 | 0.00236816 | 0.482691 | 164.004 |