| Red | Green | Blue | |
| z | 17.64 | ||
| znorm | Inf | ||
| sky | -NaN | -Inf | -Inf |
| S/N | 29.6 | 48.8 | 56.5 |
| S/N(c) | 0.0 | 0.0 | 0.0 |
| SN(E/C) |
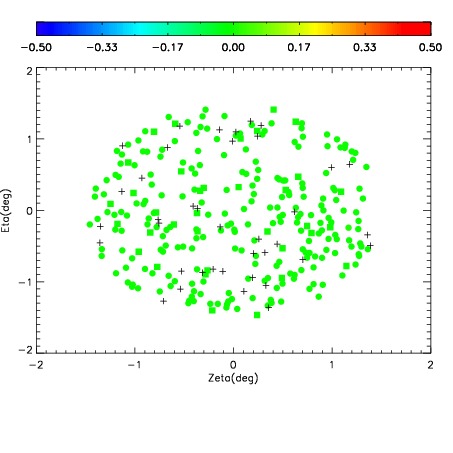
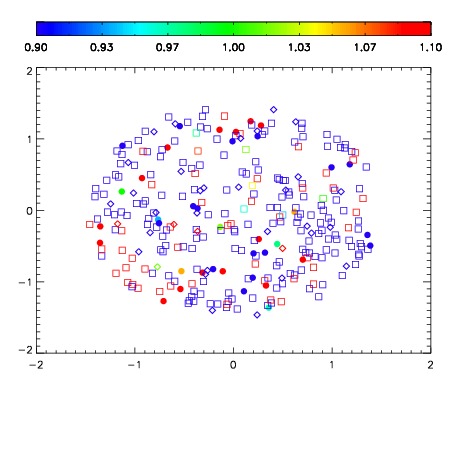
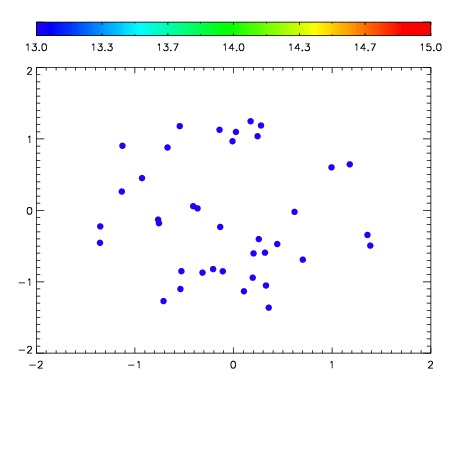

| Frame | Nreads | Zeropoints | Mag plots | Spatial mag deviation | Spatial sky 16325A emission deviations (filled: sky, open: star) | Spatial sky continuum emission | Spatial sky telluric CO2 absorption deviations (filled: H < 10) | |||||||||||||||||||||||
| 0 | 0 |
|
|
|
|
|
|
| IPAIR | NAME | SHIFT | NEWSHIFT | S/N | NAME | SHIFT | NEWSHIFT | S/N |
| 0 | 05200075 | 0.494247 | 0.00000 | 256.207 | 05200076 | -0.000455965 | 0.494703 | 257.376 |
| 1 | 05200074 | 0.493425 | 0.000821978 | 255.330 | 05200073 | -0.000927302 | 0.495174 | 255.171 |
| 2 | 05200071 | 0.489397 | 0.00485000 | 252.986 | 05200072 | 0.00123956 | 0.493007 | 255.066 |
| 3 | 05200070 | 0.487720 | 0.00652698 | 246.796 | 05200069 | 0.00000 | 0.494247 | 253.252 |