| Red | Green | Blue | |
| z | 17.64 | ||
| znorm | Inf | ||
| sky | -NaN | -Inf | -Inf |
| S/N | 32.6 | 54.5 | 64.8 |
| S/N(c) | 0.0 | 0.0 | 0.0 |
| SN(E/C) |
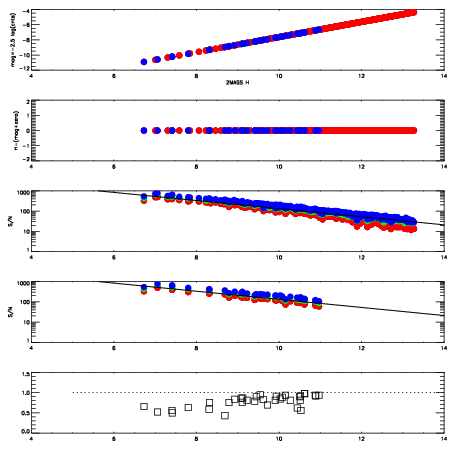
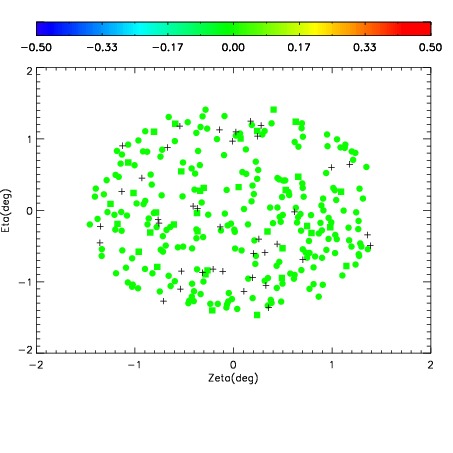
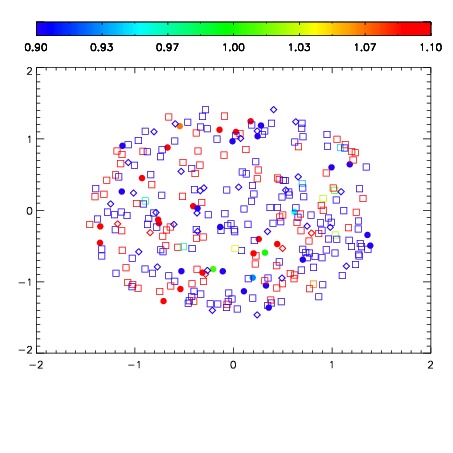
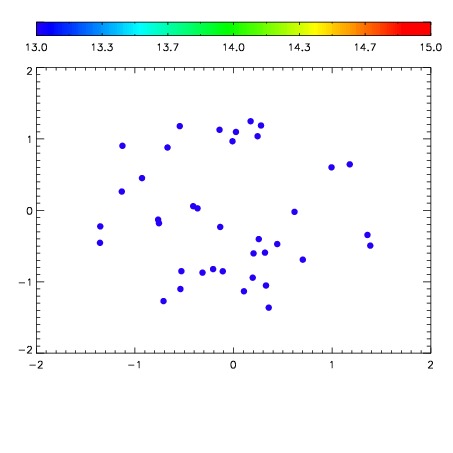

| Frame | Nreads | Zeropoints | Mag plots | Spatial mag deviation | Spatial sky 16325A emission deviations (filled: sky, open: star) | Spatial sky continuum emission | Spatial sky telluric CO2 absorption deviations (filled: H < 10) | |||||||||||||||||||||||
| 0 | 0 |
|
|
|
|
|
|
| IPAIR | NAME | SHIFT | NEWSHIFT | S/N | NAME | SHIFT | NEWSHIFT | S/N |
| 0 | 05240076 | 0.492620 | 0.00000 | 205.668 | 05240081 | 0.00257500 | 0.490045 | 202.433 |
| 1 | 05240079 | 0.491644 | 0.000975996 | 211.277 | 05240074 | 0.00000 | 0.492620 | 211.259 |
| 2 | 05240080 | 0.492504 | 0.000115991 | 210.156 | 05240078 | -3.19711e-06 | 0.492623 | 211.060 |
| 3 | 05240075 | 0.492567 | 5.29885e-05 | 208.310 | 05240077 | 0.00196698 | 0.490653 | 209.654 |
| 4 | 05240083 | 0.491770 | 0.000849992 | 196.576 | 05240082 | 0.00197316 | 0.490647 | 198.293 |