| Red | Green | Blue | |
| z | 17.64 | ||
| znorm | Inf | ||
| sky | -Inf | -Inf | -Inf |
| S/N | 28.5 | 48.7 | 55.6 |
| S/N(c) | 0.0 | 0.0 | 0.0 |
| SN(E/C) |


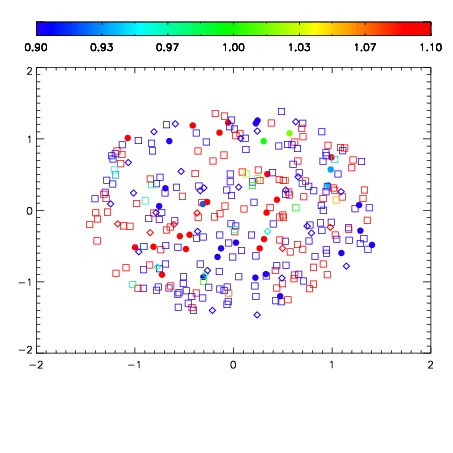
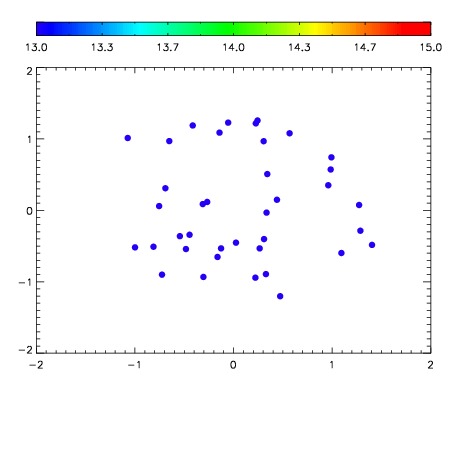

| Frame | Nreads | Zeropoints | Mag plots | Spatial mag deviation | Spatial sky 16325A emission deviations (filled: sky, open: star) | Spatial sky continuum emission | Spatial sky telluric CO2 absorption deviations (filled: H < 10) | |||||||||||||||||||||||
| 0 | 0 |
|
|
|
|
|
|
| IPAIR | NAME | SHIFT | NEWSHIFT | S/N | NAME | SHIFT | NEWSHIFT | S/N |
| 0 | 05220069 | 0.498127 | 0.00000 | 244.961 | 05220070 | 0.00225072 | 0.495876 | 243.467 |
| 1 | 05220068 | 0.497356 | 0.000771016 | 239.117 | 05220067 | 0.000661217 | 0.497466 | 241.272 |
| 2 | 05220064 | 0.495435 | 0.00269201 | 234.784 | 05220066 | 0.00260911 | 0.495518 | 238.164 |
| 3 | 05220065 | 0.495693 | 0.00243402 | 232.161 | 05220063 | 0.00000 | 0.498127 | 235.719 |