| Red | Green | Blue | |
| z | 17.64 | ||
| znorm | Inf | ||
| sky | -Inf | -Inf | -Inf |
| S/N | 25.4 | 44.4 | 49.1 |
| S/N(c) | 0.0 | 0.0 | 0.0 |
| SN(E/C) |

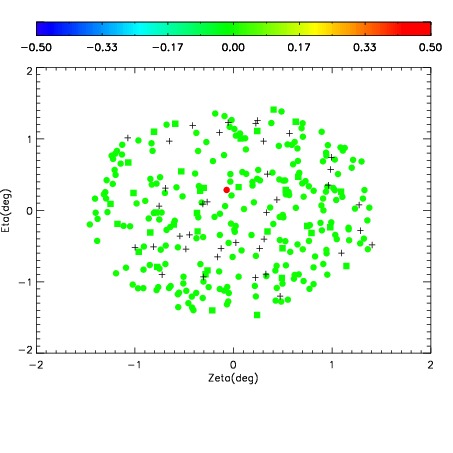
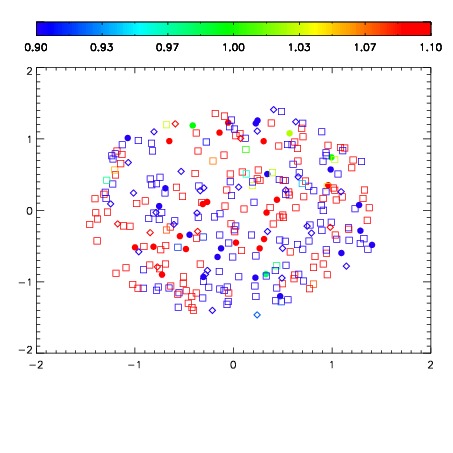
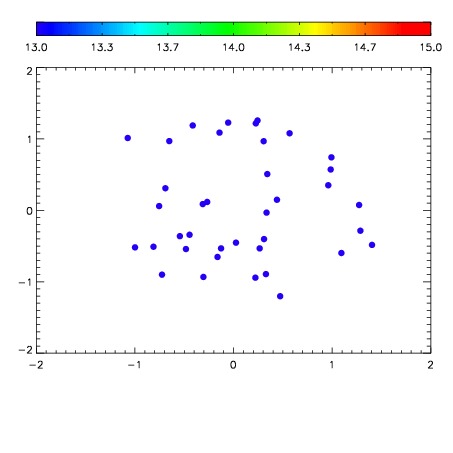

| Frame | Nreads | Zeropoints | Mag plots | Spatial mag deviation | Spatial sky 16325A emission deviations (filled: sky, open: star) | Spatial sky continuum emission | Spatial sky telluric CO2 absorption deviations (filled: H < 10) | |||||||||||||||||||||||
| 0 | 0 |
|
|
|
|
|
|
| IPAIR | NAME | SHIFT | NEWSHIFT | S/N | NAME | SHIFT | NEWSHIFT | S/N |
| 0 | 05260041 | 0.488064 | 0.00000 | 216.295 | 05260042 | -0.00170098 | 0.489765 | 215.357 |
| 1 | 05260040 | 0.487948 | 0.000115991 | 216.803 | 05260039 | 0.00000 | 0.488064 | 216.477 |
| 2 | 05260044 | 0.482422 | 0.00564200 | 215.493 | 05260043 | -0.00297871 | 0.491043 | 210.644 |
| 3 | 05260045 | 0.483323 | 0.00474098 | 209.785 | 05260046 | -0.00400038 | 0.492064 | 205.802 |