| Red | Green | Blue | |
| z | 17.64 | ||
| znorm | Inf | ||
| sky | -Inf | -Inf | -Inf |
| S/N | 24.6 | 42.1 | 44.6 |
| S/N(c) | 0.0 | 0.0 | 0.0 |
| SN(E/C) |
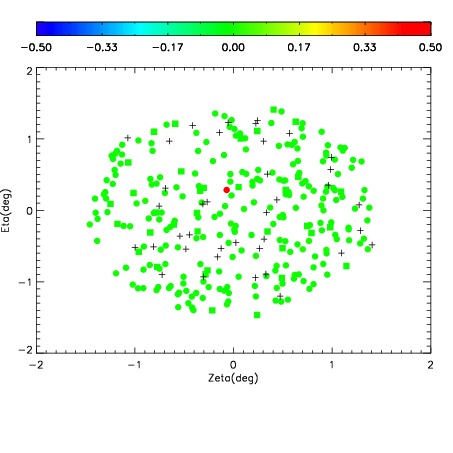
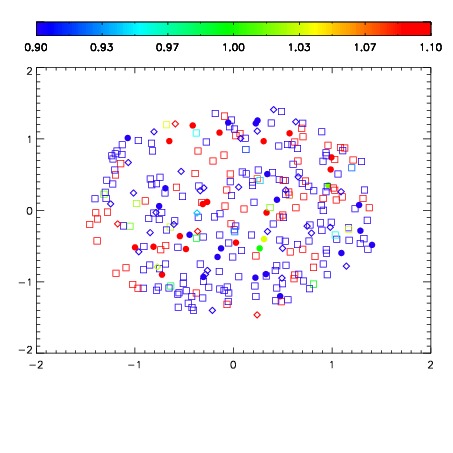
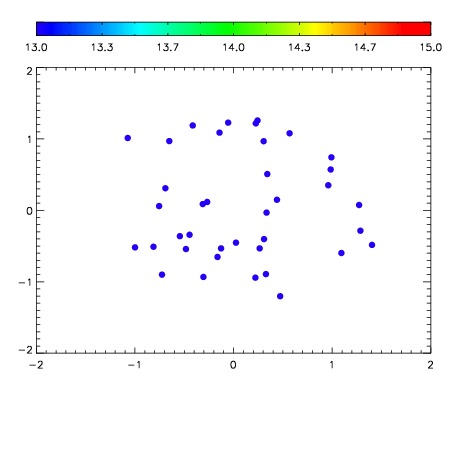

| Frame | Nreads | Zeropoints | Mag plots | Spatial mag deviation | Spatial sky 16325A emission deviations (filled: sky, open: star) | Spatial sky continuum emission | Spatial sky telluric CO2 absorption deviations (filled: H < 10) | |||||||||||||||||||||||
| 0 | 0 |
|
|
|
|
|
|
| IPAIR | NAME | SHIFT | NEWSHIFT | S/N | NAME | SHIFT | NEWSHIFT | S/N |
| 0 | 05310012 | 0.482875 | 0.00000 | 223.262 | 05310013 | -0.000504868 | 0.483380 | 220.952 |
| 1 | 05310015 | 0.482089 | 0.000785977 | 229.556 | 05310014 | -0.000175460 | 0.483050 | 228.031 |
| 2 | 05310011 | 0.481644 | 0.00123098 | 213.651 | 05310010 | 0.00000 | 0.482875 | 213.340 |