| Red | Green | Blue | |
| z | 17.64 | ||
| znorm | Inf | ||
| sky | -Inf | -Inf | -Inf |
| S/N | 29.0 | 48.2 | 52.5 |
| S/N(c) | 0.0 | 0.0 | 0.0 |
| SN(E/C) |
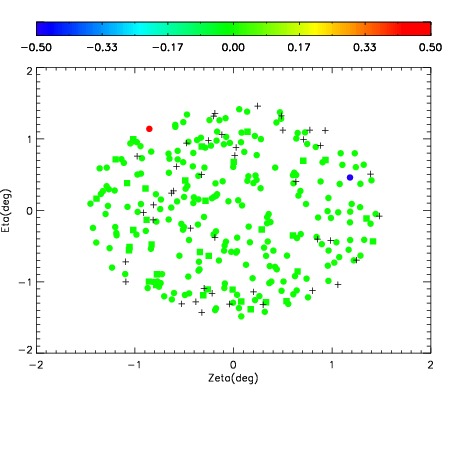
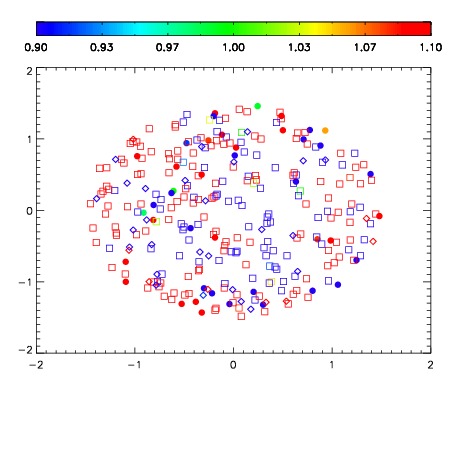
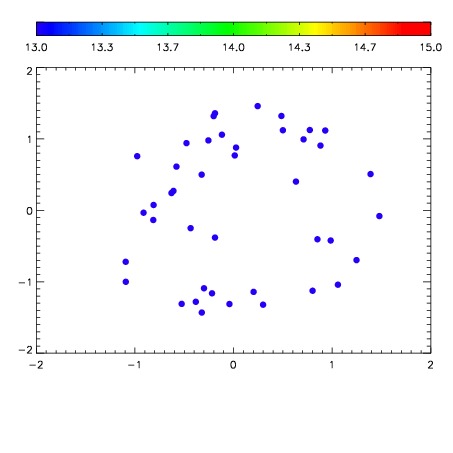

| Frame | Nreads | Zeropoints | Mag plots | Spatial mag deviation | Spatial sky 16325A emission deviations (filled: sky, open: star) | Spatial sky continuum emission | Spatial sky telluric CO2 absorption deviations (filled: H < 10) | |||||||||||||||||||||||
| 0 | 0 |
|
|
|
|
|
|
| IPAIR | NAME | SHIFT | NEWSHIFT | S/N | NAME | SHIFT | NEWSHIFT | S/N |
| 0 | 06070038 | 0.477862 | 0.00000 | 201.616 | 06070039 | 0.00200917 | 0.475853 | 198.953 |
| 1 | 06070041 | 0.476362 | 0.00150001 | 200.343 | 06070040 | 0.000364746 | 0.477497 | 198.418 |
| 2 | 06070037 | 0.477720 | 0.000142008 | 198.647 | 06070036 | 0.00000 | 0.477862 | 194.784 |
| 3 | 06070042 | 0.477369 | 0.000492990 | 196.223 | 06070043 | -0.00327046 | 0.481132 | 177.444 |