| Red | Green | Blue | |
| z | 17.64 | ||
| znorm | Inf | ||
| sky | -Inf | -NaN | -Inf |
| S/N | 29.9 | 51.8 | 54.6 |
| S/N(c) | 0.0 | 0.0 | 0.0 |
| SN(E/C) |
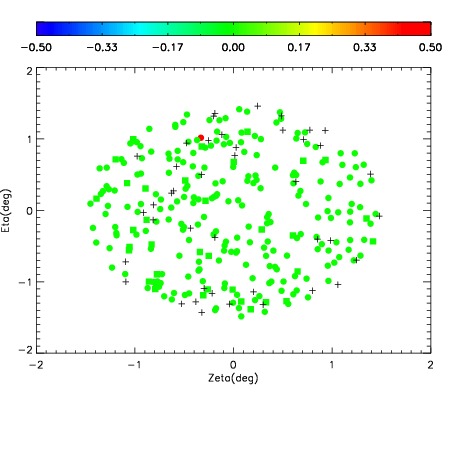
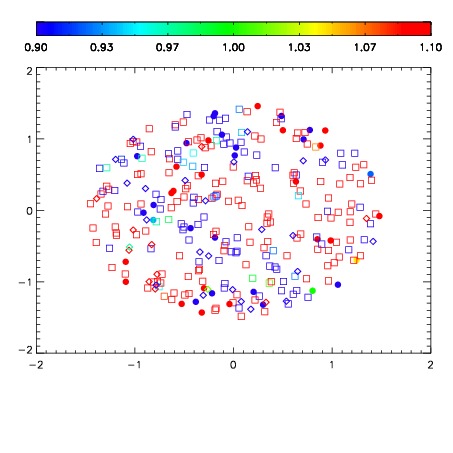
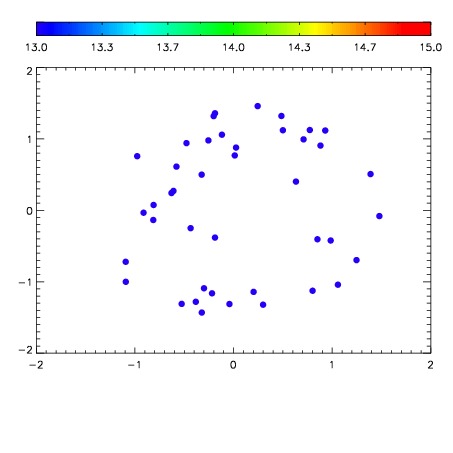

| Frame | Nreads | Zeropoints | Mag plots | Spatial mag deviation | Spatial sky 16325A emission deviations (filled: sky, open: star) | Spatial sky continuum emission | Spatial sky telluric CO2 absorption deviations (filled: H < 10) | |||||||||||||||||||||||
| 0 | 0 |
|
|
|
|
|
|
| IPAIR | NAME | SHIFT | NEWSHIFT | S/N | NAME | SHIFT | NEWSHIFT | S/N |
| 0 | 06110038 | 0.483458 | 0.00000 | 219.693 | 06110039 | 0.000373138 | 0.483085 | 213.642 |
| 1 | 06110037 | 0.482774 | 0.000684023 | 221.849 | 06110036 | 0.00000 | 0.483458 | 217.925 |
| 2 | 06110041 | 0.480122 | 0.00333601 | 208.259 | 06110043 | -0.00350881 | 0.486967 | 212.689 |
| 3 | 06110042 | 0.480645 | 0.00281301 | 205.484 | 06110040 | -0.000904340 | 0.484362 | 210.575 |