| Red | Green | Blue | |
| z | 17.64 | ||
| znorm | Inf | ||
| sky | -Inf | -Inf | -Inf |
| S/N | 25.2 | 44.7 | 46.2 |
| S/N(c) | 0.0 | 0.0 | 0.0 |
| SN(E/C) |
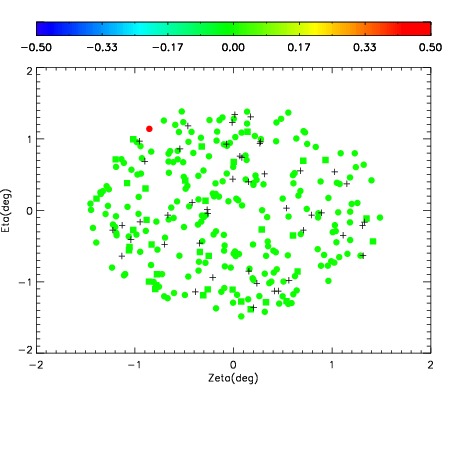
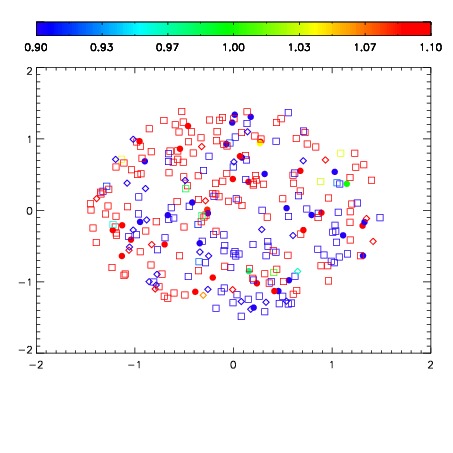
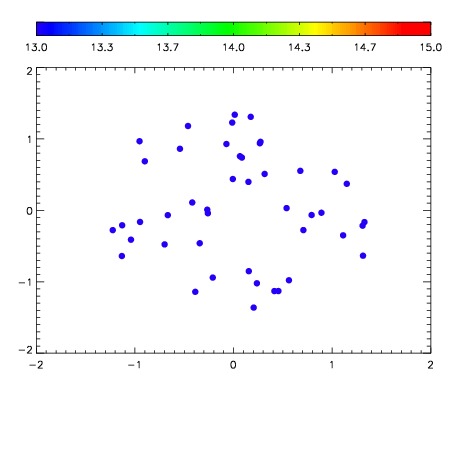

| Frame | Nreads | Zeropoints | Mag plots | Spatial mag deviation | Spatial sky 16325A emission deviations (filled: sky, open: star) | Spatial sky continuum emission | Spatial sky telluric CO2 absorption deviations (filled: H < 10) | |||||||||||||||||||||||
| 0 | 0 |
|
|
|
|
|
|
| IPAIR | NAME | SHIFT | NEWSHIFT | S/N | NAME | SHIFT | NEWSHIFT | S/N |
| 0 | 05480075 | 0.490133 | 0.00000 | 204.050 | 05480076 | 0.00235641 | 0.487777 | 202.505 |
| 1 | 05480074 | 0.488777 | 0.00135598 | 198.588 | 05480073 | -6.42046e-05 | 0.490197 | 202.338 |
| 2 | 05480071 | 0.487134 | 0.00299898 | 197.729 | 05480069 | 0.00000 | 0.490133 | 194.915 |
| 3 | 05480070 | 0.486462 | 0.00367099 | 195.836 | 05480072 | 0.000287869 | 0.489845 | 189.457 |