| Red | Green | Blue | |
| z | 17.64 | ||
| znorm | Inf | ||
| sky | -Inf | -Inf | -Inf |
| S/N | 22.9 | 42.6 | 43.4 |
| S/N(c) | 0.0 | 0.0 | 0.0 |
| SN(E/C) |
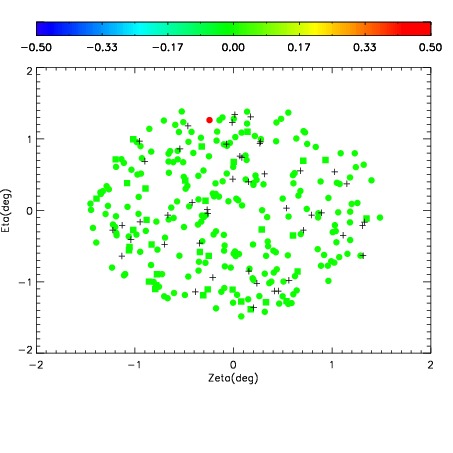
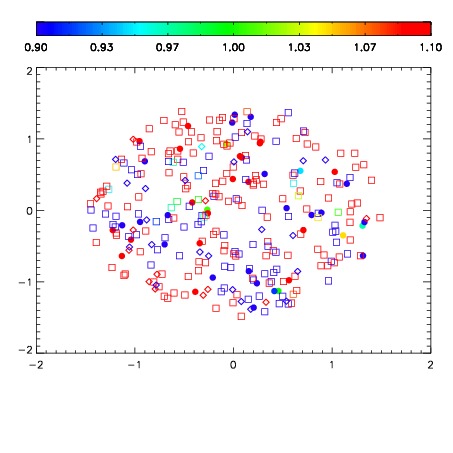
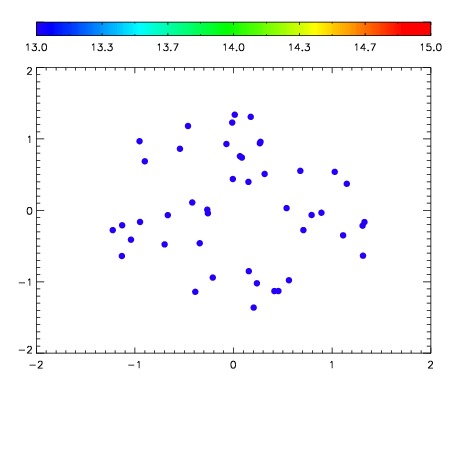

| Frame | Nreads | Zeropoints | Mag plots | Spatial mag deviation | Spatial sky 16325A emission deviations (filled: sky, open: star) | Spatial sky continuum emission | Spatial sky telluric CO2 absorption deviations (filled: H < 10) | |||||||||||||||||||||||
| 0 | 0 |
|
|
|
|
|
|
| IPAIR | NAME | SHIFT | NEWSHIFT | S/N | NAME | SHIFT | NEWSHIFT | S/N |
| 0 | 06080042 | 0.485140 | 0.00000 | 190.405 | 06080039 | 0.000795733 | 0.484344 | 192.385 |
| 1 | 06080041 | 0.484500 | 0.000640005 | 188.816 | 06080036 | 0.00000 | 0.485140 | 190.631 |
| 2 | 06080037 | 0.483351 | 0.00178900 | 185.945 | 06080040 | -0.000198993 | 0.485339 | 190.573 |
| 3 | 06080038 | 0.483931 | 0.00120899 | 183.740 | 06080043 | 0.00230232 | 0.482838 | 188.013 |