| Red | Green | Blue | |
| z | 17.64 | ||
| znorm | Inf | ||
| sky | -Inf | -Inf | -Inf |
| S/N | 39.3 | 67.0 | 70.4 |
| S/N(c) | 0.0 | 0.0 | 0.0 |
| SN(E/C) |
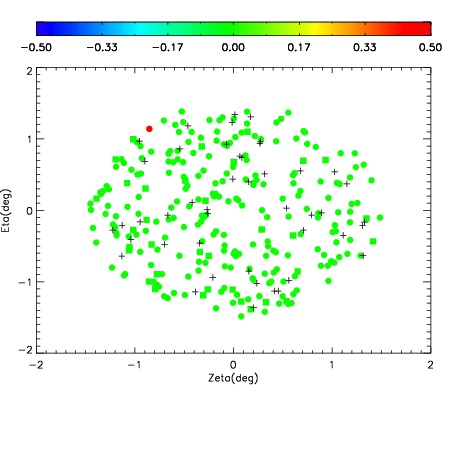

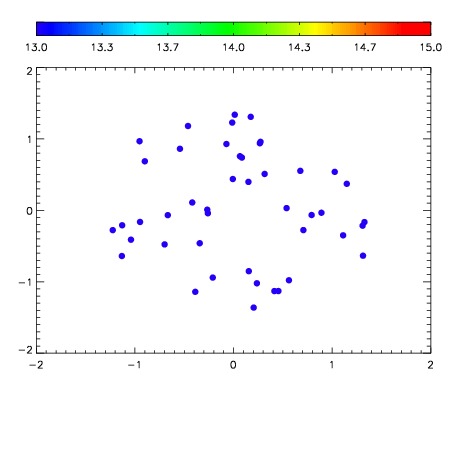

| Frame | Nreads | Zeropoints | Mag plots | Spatial mag deviation | Spatial sky 16325A emission deviations (filled: sky, open: star) | Spatial sky continuum emission | Spatial sky telluric CO2 absorption deviations (filled: H < 10) | |||||||||||||||||||||||
| 0 | 0 |
|
|
|
|
|
|
| IPAIR | NAME | SHIFT | NEWSHIFT | S/N | NAME | SHIFT | NEWSHIFT | S/N |
| 0 | 06410034 | 0.483310 | 0.00000 | 206.374 | 06410033 | 0.00219654 | 0.481113 | 207.069 |
| 1 | 06410027 | 0.482806 | 0.000504017 | 215.342 | 06410028 | 0.000491754 | 0.482818 | 217.169 |
| 2 | 06410026 | 0.482192 | 0.00111800 | 214.806 | 06410025 | 0.00000 | 0.483310 | 215.620 |
| 3 | 06410030 | 0.481372 | 0.00193802 | 212.637 | 06410029 | -0.000324464 | 0.483634 | 211.918 |
| 4 | 06410031 | 0.482219 | 0.00109100 | 211.229 | 06410032 | 0.00106088 | 0.482249 | 211.848 |
| 5 | 06410035 | 0.483146 | 0.000164002 | 205.435 | 06410036 | 0.00342478 | 0.479885 | 202.239 |
| 6 | 06410038 | 0.483066 | 0.000244021 | 198.572 | 06410037 | 0.00183297 | 0.481477 | 197.682 |