| Red | Green | Blue | |
| z | 17.64 | ||
| znorm | Inf | ||
| sky | -Inf | -Inf | -Inf |
| S/N | 24.5 | 43.5 | 47.8 |
| S/N(c) | 0.0 | 0.0 | 0.0 |
| SN(E/C) |
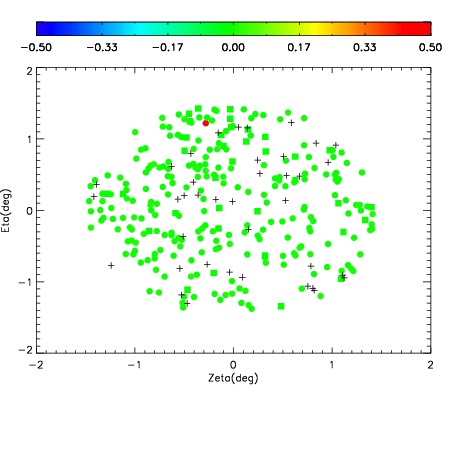
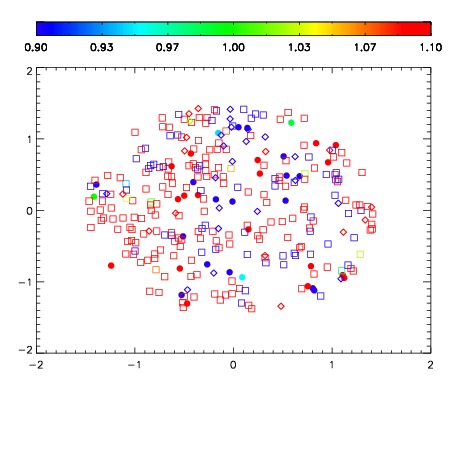
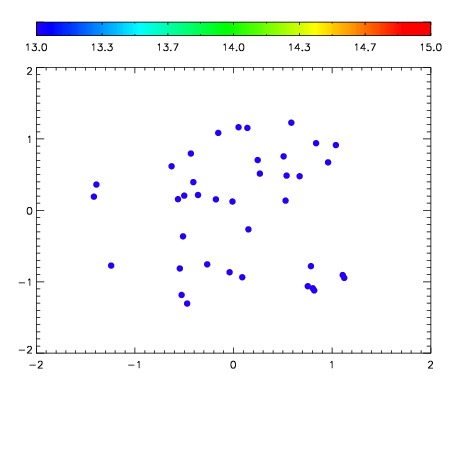

| Frame | Nreads | Zeropoints | Mag plots | Spatial mag deviation | Spatial sky 16325A emission deviations (filled: sky, open: star) | Spatial sky continuum emission | Spatial sky telluric CO2 absorption deviations (filled: H < 10) | |||||||||||||||||||||||
| 0 | 0 |
|
|
|
|
|
|
| IPAIR | NAME | SHIFT | NEWSHIFT | S/N | NAME | SHIFT | NEWSHIFT | S/N |
| 0 | 02790027 | 0.418248 | 0.00000 | 190.376 | 02790028 | -0.000362988 | 0.418611 | 196.123 |
| 1 | 02790030 | 0.414496 | 0.00375199 | 191.906 | 02790025 | 0.00000 | 0.418248 | 199.904 |
| 2 | 02790031 | 0.417508 | 0.000739992 | 191.155 | 02790029 | -0.00165445 | 0.419902 | 199.504 |
| 3 | 02790026 | 0.415960 | 0.00228798 | 186.765 | 02790032 | -0.000551388 | 0.418799 | 193.675 |