| Red | Green | Blue | |
| z | 17.64 | ||
| znorm | Inf | ||
| sky | -Inf | -Inf | -Inf |
| S/N | 29.1 | 49.7 | 54.7 |
| S/N(c) | 0.0 | 0.0 | 0.0 |
| SN(E/C) |
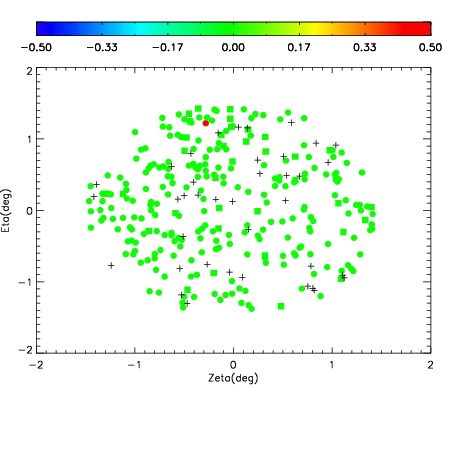
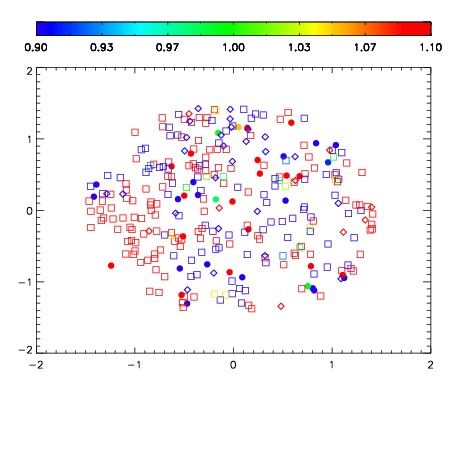
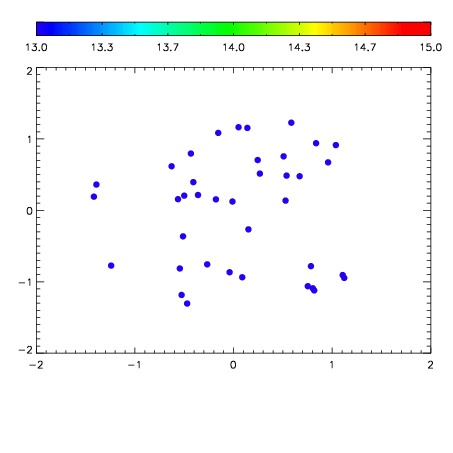

| Frame | Nreads | Zeropoints | Mag plots | Spatial mag deviation | Spatial sky 16325A emission deviations (filled: sky, open: star) | Spatial sky continuum emission | Spatial sky telluric CO2 absorption deviations (filled: H < 10) | |||||||||||||||||||||||
| 0 | 0 |
|
|
|
|
|
|
| IPAIR | NAME | SHIFT | NEWSHIFT | S/N | NAME | SHIFT | NEWSHIFT | S/N |
| 0 | 06060027 | 0.480955 | 0.00000 | 239.651 | 06060028 | -0.00144667 | 0.482402 | 244.020 |
| 1 | 06060030 | 0.478935 | 0.00202000 | 238.034 | 06060029 | 0.00598503 | 0.474970 | 235.793 |
| 2 | 06060026 | 0.479858 | 0.00109699 | 237.384 | 06060032 | 0.00371686 | 0.477238 | 235.151 |
| 3 | 06060031 | 0.479709 | 0.00124601 | 234.083 | 06060025 | 0.00000 | 0.480955 | 233.549 |