| Red | Green | Blue | |
| z | 17.64 | ||
| znorm | Inf | ||
| sky | -Inf | -Inf | -Inf |
| S/N | 10.1 | 19.2 | 24.0 |
| S/N(c) | 0.0 | 0.0 | 0.0 |
| SN(E/C) |
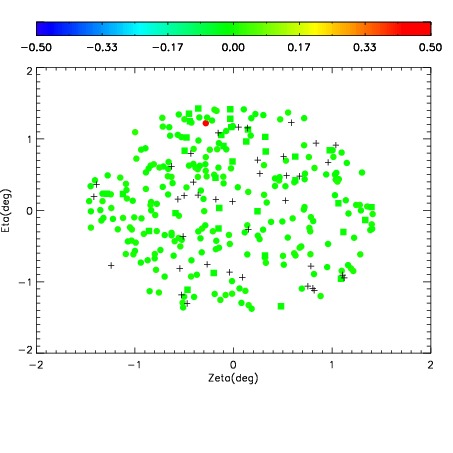
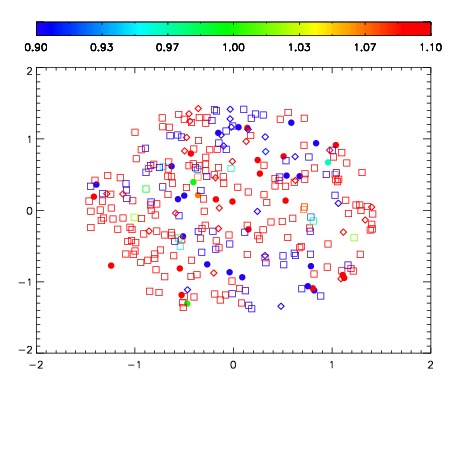
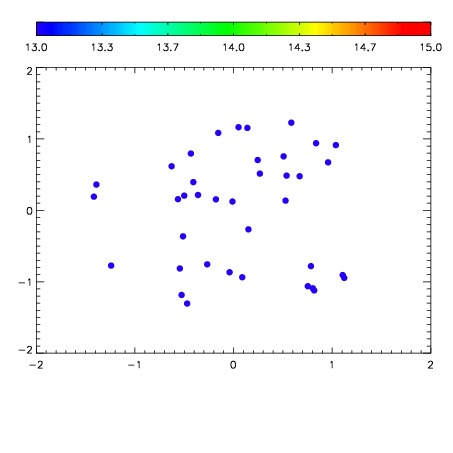

| Frame | Nreads | Zeropoints | Mag plots | Spatial mag deviation | Spatial sky 16325A emission deviations (filled: sky, open: star) | Spatial sky continuum emission | Spatial sky telluric CO2 absorption deviations (filled: H < 10) | |||||||||||||||||||||||
| 0 | 0 |
|
|
|
|
|
|
| IPAIR | NAME | SHIFT | NEWSHIFT | S/N | NAME | SHIFT | NEWSHIFT | S/N |
| 0 | 06620027 | 0.478618 | 0.00000 | 165.320 | 06620028 | 0.000161330 | 0.478457 | 145.143 |
| 1 | 06620026 | 0.478453 | 0.000164986 | 123.005 | 06620021 | 0.00000 | 0.478618 | 108.475 |
| 2 | 06620022 | 0.477645 | 0.000972986 | 65.4673 | 06620025 | -0.000715096 | 0.479333 | 93.9249 |
| 3 | 06620023 | 0.478505 | 0.000113010 | 51.5858 | 06620024 | 0.000249808 | 0.478368 | 87.8254 |